Data provenance is the documented history of where data originated — its source systems, how it was collected, and who created it. Data lineage is the broader record of how data has moved and transformed from its origin through every pipeline stage to its current form — which tables it was joined to, which transformations were applied, which columns were derived from which source fields. Together, provenance and lineage answer the question “where did this data come from and what happened to it?” — making it possible to debug wrong results, assess the trustworthiness of a dataset, satisfy compliance requirements, and understand the blast radius of upstream data changes.
Introduction
Every number in a dashboard, every feature in a machine learning model, every metric in a business report has a history. It came from somewhere, it was transformed along the way, and the quality and trustworthiness of that number depends entirely on the integrity of that history.
Imagine a senior executive questions why the revenue number in this morning’s report differs from the number they saw yesterday. Without data lineage, answering this question requires hours of code archaeology — tracing backwards through multiple SQL transformations, Python scripts, and pipeline stages, trying to reconstruct what happened. With data lineage, the answer is a few clicks: here are all the upstream tables that feed into this number, here is the transformation that changed yesterday, and here is the specific column mapping that produced the discrepancy.
Now consider a regulatory audit asking you to demonstrate that customer data processed for a marketing campaign was properly consented. Without data provenance, you cannot answer this question. With provenance, you can point to the source system timestamp, the consent flag at the time of collection, and every transformation that data passed through.
Or imagine a data engineer changes a source table schema — renames a column from cust_id to customer_id. Without lineage, they have no idea which of the 200 downstream tables, models, and reports will break. With lineage, they can see every downstream consumer of that column and coordinate changes proactively.
Provenance and lineage are not abstract concepts — they are the practical infrastructure that makes large data systems trustworthy, debuggable, and maintainable. This article explains what they are, why they matter, how they’re implemented in modern data tools, and how data scientists can both benefit from and contribute to good lineage practices in their own work.
Data Provenance: Where Did This Data Come From?
Data provenance (from the French provenir — “to come from”) answers the question: what is the origin and history of a piece of data?
Provenance documentation answers:
- What source system did this data come from?
- How was it collected? (manual entry, sensor reading, API call, form submission, click event)
- When was it collected?
- Who collected or created it?
- What were the conditions under which it was collected?
- Has it been modified since collection, and by whom?
Why Provenance Matters
Trustworthiness assessment: A revenue figure from a validated financial system is more trustworthy than one derived from a manually maintained spreadsheet. Knowing the origin lets you assess the data’s reliability.
Regulatory compliance: GDPR, HIPAA, CCPA, and SOX all have data origin and handling requirements. “Where did you get this customer’s data, and did you have the right to use it for this purpose?” requires provenance to answer.
Reproducibility: Can you reproduce the exact dataset used to train a model from six months ago? Only if you recorded provenance: which data sources, which version, which time window.
Bias detection: A training dataset collected only in summer might produce a seasonal model. A survey conducted only online might miss offline populations. Provenance tells you the collection conditions that might introduce bias.
# Documenting provenance in practice: metadata attached to datasets
import json
from datetime import datetime, timezone
from dataclasses import dataclass, field, asdict
from typing import Optional

@dataclass
class DataProvenance:
    """
    Records the provenance metadata for a dataset or DataFrame.
    Attach to any dataset being created or consumed.
    """
    # Source information
    source_system:    str
    source_table:     Optional[str] = None
    source_query:     Optional[str] = None
    source_file:      Optional[str] = None
    source_api:       Optional[str] = None

    # Collection context
    collection_method: str = "automated_pipeline"  # 'sensor', 'manual_entry', 'api', 'scrape', etc.
    collection_start:  Optional[str] = None   # ISO timestamp of earliest record
    collection_end:    Optional[str] = None   # ISO timestamp of latest record

    # Processing context
    extracted_at:     str = field(default_factory=lambda: datetime.now(timezone.utc).isoformat())
    extracted_by:     str = "data_pipeline"   # Pipeline name or user
    pipeline_version: str = "unknown"
    processing_notes: str = ""

    # Quality and trust
    row_count:        Optional[int] = None
    known_issues:     list = field(default_factory=list)
    data_classification: str = "internal"  # 'public', 'internal', 'confidential', 'restricted'

    def to_dict(self) -> dict:
        return asdict(self)

    def to_json(self) -> str:
        return json.dumps(self.to_dict(), indent=2)

    def save(self, filepath: str):
        with open(filepath, "w") as f:
            f.write(self.to_json())

    @classmethod
    def load(cls, filepath: str) -> "DataProvenance":
        with open(filepath) as f:
            data = json.load(f)
        return cls(**data)


# Attach provenance when creating a dataset
import pandas as pd

# Extract data from warehouse
df = pd.read_sql("""
    SELECT customer_id, email, signup_date, lifetime_value
    FROM dim_customer
    WHERE is_current = TRUE
    AND signup_date >= '2020-01-01'
""", engine)

# Record its provenance
provenance = DataProvenance(
    source_system     = "analytics_warehouse",
    source_table      = "dim_customer",
    source_query      = "SELECT ... WHERE is_current=TRUE AND signup_date>='2020-01-01'",
    collection_method = "sql_query",
    collection_start  = str(df["signup_date"].min()),
    collection_end    = str(df["signup_date"].max()),
    extracted_by      = "churn_model_pipeline_v2",
    pipeline_version  = "2.1.3",
    row_count         = len(df),
    data_classification = "confidential",
    known_issues      = [
        "signup_date may be NULL for SSO customers imported before 2021-06"
    ]
)

# Save both data and provenance together
df.to_parquet("data/processed/customers.parquet", index=False)
provenance.save("data/processed/customers.provenance.json")

print(provenance.to_json())
Data Lineage: What Happened to the Data Along the Way?
Data lineage maps the complete journey of data from its sources through every transformation to its current form. While provenance answers “where did this come from?”, lineage answers “what path did it take, and what was done to it?”
The Three Levels of Data Lineage
Table-level lineage: Which tables fed into this table? Which tables does this table feed into?
orders_raw  ──┐
customers_raw─┼──► stg_orders ──► fct_sales ──► monthly_revenue_summary
products_raw ─┘Column-level lineage: Which source column produced this output column? Through what transformations?
fct_sales.line_revenue
    ← stg_order_items.quantity × stg_order_items.unit_price
        ← raw_orders.item_qty (cast to integer, NULL → 0)
← raw_orders.unit_price_usd (cast to DECIMAL(10,2))Record-level lineage: Which specific source records produced this output record? (Rarely tracked due to volume, but valuable for auditing individual records.)
Building a Simple Lineage Tracker in Python
import json
from dataclasses import dataclass, field, asdict
from typing import Optional
from datetime import datetime, timezone
from pathlib import Path

@dataclass
class ColumnMapping:
    """Records how one output column was derived from source columns."""
    output_column:   str
    source_columns:  list           # List of source columns that contributed
    transformation:  str            # Description of transformation
    is_direct_copy:  bool = False   # True if value is unchanged from source
    formula:         Optional[str] = None  # SQL expression or formula

@dataclass
class DatasetLineage:
    """
    Records the complete lineage for one dataset creation step.
    Captures inputs, outputs, transformations, and execution metadata.
    """
    # Identity
    output_dataset:   str           # Name/path of the output dataset
    step_name:        str           # Human-readable name of this step
    step_type:        str           # 'sql_transform', 'python_transform', 'join', 'filter', etc.

    # Inputs
    input_datasets:   list = field(default_factory=list)  # List of input dataset names

    # Column-level mapping
    column_mappings:  list = field(default_factory=list)  # List of ColumnMapping dicts

    # Execution metadata
    executed_at:      str = field(default_factory=lambda: datetime.now(timezone.utc).isoformat())
    executed_by:      str = "pipeline"
    code_reference:   Optional[str] = None  # File path or git commit
    sql_query:        Optional[str] = None  # SQL used (if applicable)

    # Output stats
    rows_in:   Optional[int] = None
    rows_out:  Optional[int] = None
    duration_seconds: Optional[float] = None

    def add_column_mapping(self, output_col: str, source_cols: list,
                            transformation: str, formula: str = None,
                            is_direct: bool = False):
        self.column_mappings.append(ColumnMapping(
            output_column=output_col, source_columns=source_cols,
            transformation=transformation, formula=formula,
            is_direct_copy=is_direct
        ))

    def to_dict(self) -> dict:
        d = asdict(self)
        d["executed_at"] = self.executed_at
        return d

    def save(self, lineage_dir: str = "lineage"):
        Path(lineage_dir).mkdir(parents=True, exist_ok=True)
        safe_name = self.output_dataset.replace("/", "_").replace(".", "_")
        filepath = f"{lineage_dir}/{safe_name}_lineage.json"
        with open(filepath, "w") as f:
            json.dump(self.to_dict(), f, indent=2)
        return filepath


# Document lineage for a feature engineering step
lineage = DatasetLineage(
    output_dataset = "data/processed/customer_churn_features.parquet",
    step_name      = "Customer Churn Feature Engineering",
    step_type      = "python_transform",
    input_datasets = [
        "analytics_warehouse.dim_customer",
        "analytics_warehouse.fact_sales",
        "analytics_warehouse.fact_support_tickets"
    ],
    executed_by    = "churn_pipeline_v2",
    code_reference = "pipelines/churn_features.py:transform_order_features()",
    rows_in        = 12847,
    rows_out       = 9234
)

# Document column-level lineage
lineage.add_column_mapping(
    output_col    = "lifetime_value",
    source_cols   = ["fact_sales.line_revenue"],
    transformation= "SUM aggregation over all orders",
    formula       = "SUM(fact_sales.line_revenue) GROUP BY customer_key",
    is_direct     = False
)
lineage.add_column_mapping(
    output_col    = "recency_days",
    source_cols   = ["fact_sales.order_date"],
    transformation= "Days from most recent order to reference date",
    formula       = "DATEDIFF(reference_date, MAX(order_date))",
    is_direct     = False
)
lineage.add_column_mapping(
    output_col    = "customer_segment",
    source_cols   = ["dim_customer.customer_segment"],
    transformation= "Direct copy from current customer dimension record",
    is_direct     = True
)
lineage.add_column_mapping(
    output_col    = "n_high_severity_tickets",
    source_cols   = ["fact_support_tickets.severity"],
    transformation= "Count of tickets where severity = 'high'",
    formula       = "SUM(CASE WHEN severity = 'high' THEN 1 ELSE 0 END)",
    is_direct     = False
)

filepath = lineage.save("lineage/")
print(f"Lineage saved to: {filepath}")Lineage in the Modern Data Stack
In practice, lineage is tracked at different levels of sophistication depending on the tools in use.
dbt: Automatic Table-Level Lineage
dbt (data build tool) provides automatic table-level lineage as a core feature. Because every dbt model references its dependencies using {{ ref('model_name') }}, dbt can construct a complete dependency graph of every table in the warehouse.
-- models/marts/fct_sales.sql
-- dbt automatically knows this model depends on stg_orders, stg_customers, stg_products
-- because of the {{ ref() }} calls

WITH orders AS (
    SELECT * FROM {{ ref('stg_orders') }}
),
customers AS (
    SELECT * FROM {{ ref('stg_customers') }}
),
products AS (
    SELECT * FROM {{ ref('stg_products') }}
)

SELECT
    o.order_id,
    c.customer_key,
    p.product_key,
    o.order_date,
    p.quantity * p.unit_price AS line_revenue
FROM orders o
JOIN customers c ON o.customer_id = c.customer_id
JOIN products p ON o.order_id = p.order_idRunning dbt docs generate and dbt docs serve produces an interactive lineage graph in the browser showing the complete DAG from raw sources to final marts. Every model can see its direct dependencies and all downstream consumers.
# sources.yml — documents raw source tables (root of the lineage)
version: 2

sources:
  - name: postgres_ecommerce
    description: "Production e-commerce PostgreSQL database"
    database: raw
    schema: public
    tables:
      - name: orders
        description: "Raw order records from the e-commerce platform"
        columns:
          - name: order_id
            description: "Unique order identifier"
            tests: [unique, not_null]
          - name: customer_id
            description: "FK to customers table"
          - name: created_at
description: "UTC timestamp when order was placed"Apache Atlas and OpenLineage
For non-dbt environments, dedicated lineage tools track data movement across heterogeneous systems:
Apache Atlas is an open-source metadata and governance platform that automatically captures lineage from Hive, Spark, Kafka, and other Hadoop ecosystem tools.
OpenLineage is an open standard for lineage collection that integrates with Spark, Airflow, dbt, Flink, and other tools, sending lineage events to backends like Marquez or Atlan.
# OpenLineage: emitting lineage events from a Python pipeline
# pip install openlineage-python

from openlineage.client import OpenLineageClient
from openlineage.client.run import (
    RunEvent, RunState, Run, Job,
    Dataset, InputDataset, OutputDataset
)
from openlineage.client.facet import (
    SchemaDatasetFacet, SchemaField,
    SqlJobFacet, DataQualityMetricsInputDatasetFacet
)
import uuid
from datetime import datetime, timezone

# Initialize the client
client = OpenLineageClient(url="http://lineage-server:5000")

run_id  = str(uuid.uuid4())
job_name = "customer_churn_feature_pipeline"
namespace = "data-science-team"

# Emit START event
client.emit(RunEvent(
    eventType=RunState.START,
    eventTime=datetime.now(timezone.utc).isoformat(),
    run=Run(runId=run_id),
    job=Job(namespace=namespace, name=job_name),
    inputs=[
        InputDataset(
            namespace="analytics-warehouse",
            name="dim_customer",
            facets={
                "schema": SchemaDatasetFacet(fields=[
                    SchemaField(name="customer_key", type="INTEGER"),
                    SchemaField(name="customer_id",  type="VARCHAR"),
                    SchemaField(name="customer_segment", type="VARCHAR"),
                ])
            }
        ),
        InputDataset(namespace="analytics-warehouse", name="fact_sales"),
    ],
    outputs=[
        OutputDataset(
            namespace="data-lake",
            name="customer_churn_features",
            facets={
                "schema": SchemaDatasetFacet(fields=[
                    SchemaField(name="customer_id",      type="VARCHAR"),
                    SchemaField(name="lifetime_value",   type="DOUBLE"),
                    SchemaField(name="recency_days",     type="INTEGER"),
                    SchemaField(name="customer_segment", type="VARCHAR"),
                ])
            }
        )
    ]
))

# ... run the actual pipeline ...
features_df = run_pipeline()

# Emit COMPLETE event with statistics
client.emit(RunEvent(
    eventType=RunState.COMPLETE,
    eventTime=datetime.now(timezone.utc).isoformat(),
    run=Run(runId=run_id),
    job=Job(namespace=namespace, name=job_name),
    inputs=[InputDataset(namespace="analytics-warehouse", name="dim_customer")],
    outputs=[OutputDataset(
        namespace="data-lake",
        name="customer_churn_features",
        facets={
            "dataQualityMetrics": DataQualityMetricsInputDatasetFacet(
                rowCount=len(features_df),
                bytes=features_df.memory_usage(deep=True).sum(),
                columnMetrics={}
            )
        }
    )]
))Building a Lightweight Lineage Graph
For teams without dedicated lineage infrastructure, a simple lineage graph can be built and visualized in Python using NetworkX:
import networkx as nx
import json
from pathlib import Path
from typing import Optional

class LineageGraph:
    """
    A lightweight DAG-based lineage tracker.

    Represents datasets as nodes and transformations as edges.
    Supports forward (impact) and backward (root cause) traversal.
    """

    def __init__(self):
        self.graph = nx.DiGraph()

    def add_dataset(self, name: str, dataset_type: str = "table",
                     description: str = "", system: str = "unknown",
                     metadata: dict = None):
        """Register a dataset as a node in the lineage graph."""
        self.graph.add_node(name, **{
            "type":        dataset_type,
            "description": description,
            "system":      system,
            "metadata":    metadata or {}
        })

    def add_transformation(self, inputs: list, output: str,
                            step_name: str, step_type: str = "transform",
                            code_ref: str = None, description: str = ""):
        """
        Record a transformation step: inputs → output.

        Adds the output dataset if not already registered,
        and creates edges from each input to the output.
        """
        # Ensure output node exists
        if output not in self.graph:
            self.graph.add_node(output, type="table", system="derived")

        for input_ds in inputs:
            if input_ds not in self.graph:
                self.graph.add_node(input_ds, type="table", system="source")
            self.graph.add_edge(input_ds, output, **{
                "step_name":   step_name,
                "step_type":   step_type,
                "code_ref":    code_ref,
                "description": description
            })

    def get_upstream(self, dataset: str, depth: int = None) -> set:
        """
        Get all datasets that (directly or indirectly) feed into the given dataset.

        Parameters
        ----------
        dataset : str
            Target dataset name.
        depth : int, optional
            Maximum hops upstream. None = unlimited.

        Returns
        -------
        set
            All ancestor dataset names.
        """
        if depth is None:
            return set(nx.ancestors(self.graph, dataset))
        ancestors = set()
        frontier = {dataset}
        for _ in range(depth):
            new_frontier = set()
            for node in frontier:
                parents = set(self.graph.predecessors(node))
                new_frontier |= parents - ancestors
                ancestors |= parents
            frontier = new_frontier
            if not frontier:
                break
        return ancestors

    def get_downstream(self, dataset: str, depth: int = None) -> set:
        """
        Get all datasets that (directly or indirectly) depend on the given dataset.
        Essential for impact analysis: 'if I change X, what breaks?'
        """
        if depth is None:
            return set(nx.descendants(self.graph, dataset))
        descendants = set()
        frontier = {dataset}
        for _ in range(depth):
            new_frontier = set()
            for node in frontier:
                children = set(self.graph.successors(node))
                new_frontier |= children - descendants
                descendants |= children
            frontier = new_frontier
            if not frontier:
                break
        return descendants

    def get_lineage_path(self, source: str, destination: str) -> list:
        """
        Find the transformation path from source to destination.

        Returns the list of datasets in order from source to destination.
        """
        try:
            path = nx.shortest_path(self.graph, source, destination)
            return path
        except (nx.NetworkXNoPath, nx.NodeNotFound):
            return []

    def impact_analysis(self, changed_dataset: str) -> dict:
        """
        Analyze the impact of changing or removing a dataset.
        Returns all downstream consumers grouped by distance.
        """
        downstream = list(nx.descendants(self.graph, changed_dataset))
        impact_by_distance = {}

        for ds in downstream:
            try:
                distance = len(nx.shortest_path(
                    self.graph, changed_dataset, ds
                )) - 1
                if distance not in impact_by_distance:
                    impact_by_distance[distance] = []
                impact_by_distance[distance].append(ds)
            except nx.NetworkXNoPath:
                pass

        print(f"\nImpact Analysis: '{changed_dataset}' changed")
        print(f"Total affected downstream datasets: {len(downstream)}")
        for dist, datasets in sorted(impact_by_distance.items()):
            print(f"  Distance {dist}: {datasets}")

        return impact_by_distance

    def visualize(self, highlight_node: str = None, figsize: tuple = (14, 8)):
        """Plot the lineage graph using matplotlib."""
        import matplotlib.pyplot as plt

        pos = nx.spring_layout(self.graph, seed=42, k=2)

        # Color nodes by type
        type_colors = {
            "source":  "#3498DB",
            "table":   "#2ECC71",
            "model":   "#9B59B6",
            "report":  "#E67E22",
            "derived": "#95A5A6"
        }

        node_colors = [
            "#E74C3C" if n == highlight_node
            else type_colors.get(self.graph.nodes[n].get("type", "table"), "#95A5A6")
            for n in self.graph.nodes
        ]

        fig, ax = plt.subplots(figsize=figsize)
        nx.draw(
            self.graph, pos, ax=ax,
            node_color=node_colors,
            node_size=2000,
            with_labels=True,
            font_size=9,
            font_weight="bold",
            edge_color="#BDC3C7",
            arrows=True,
            arrowsize=20
        )

        # Add legend
        from matplotlib.patches import Patch
        legend_elements = [Patch(facecolor=c, label=t)
                           for t, c in type_colors.items()]
        if highlight_node:
            legend_elements.append(Patch(facecolor="#E74C3C",
                                          label=f"Changed: {highlight_node}"))
        ax.legend(handles=legend_elements, loc="upper left")

        ax.set_title("Data Lineage Graph", fontsize=14, fontweight="bold")
        plt.tight_layout()
        return fig

    def to_json(self) -> str:
        """Serialize the lineage graph to JSON."""
        data = {
            "nodes": [
                {"id": n, **self.graph.nodes[n]}
                for n in self.graph.nodes
            ],
            "edges": [
                {"source": u, "target": v, **self.graph.edges[u, v]}
                for u, v in self.graph.edges
            ]
        }
        return json.dumps(data, indent=2)


# Build the lineage graph for a typical analytics stack
lg = LineageGraph()

# Source systems
lg.add_dataset("postgres.orders",    "source", "Raw orders from e-commerce DB",   "PostgreSQL")
lg.add_dataset("postgres.customers", "source", "Raw customer records",             "PostgreSQL")
lg.add_dataset("postgres.products",  "source", "Raw product catalog",              "PostgreSQL")
lg.add_dataset("salesforce.accounts","source", "B2B account data from Salesforce", "Salesforce")
lg.add_dataset("mixpanel.events",    "source", "Product analytics events",         "Mixpanel")

# Staging layer
lg.add_transformation(
    inputs=["postgres.orders"], output="warehouse.stg_orders",
    step_name="Stage Orders", step_type="dbt_model",
    code_ref="models/staging/stg_orders.sql",
    description="Clean, type-cast, and filter raw orders"
)
lg.add_transformation(
    inputs=["postgres.customers", "salesforce.accounts"],
    output="warehouse.stg_customers",
    step_name="Stage Customers", step_type="dbt_model",
    code_ref="models/staging/stg_customers.sql",
    description="Merge e-commerce and CRM customer records"
)
lg.add_transformation(
    inputs=["postgres.products"], output="warehouse.stg_products",
    step_name="Stage Products", step_type="dbt_model",
    code_ref="models/staging/stg_products.sql"
)

# Core fact table
lg.add_transformation(
    inputs=["warehouse.stg_orders", "warehouse.stg_customers",
            "warehouse.stg_products"],
    output="warehouse.fct_sales",
    step_name="Build Sales Fact", step_type="dbt_model",
    code_ref="models/marts/fct_sales.sql",
    description="Star schema fact table at order-item grain"
)

# Mart/aggregation layer
lg.add_transformation(
    inputs=["warehouse.fct_sales", "warehouse.stg_customers"],
    output="warehouse.mart_customer_summary",
    step_name="Customer Summary Mart", step_type="dbt_model",
    code_ref="models/marts/mart_customer_summary.sql"
)
lg.add_transformation(
    inputs=["warehouse.fct_sales"],
    output="warehouse.mart_daily_revenue",
    step_name="Daily Revenue Mart", step_type="dbt_model"
)

# ML features
lg.add_transformation(
    inputs=["warehouse.mart_customer_summary", "mixpanel.events"],
    output="feature_store.churn_features",
    step_name="Churn Feature Engineering", step_type="python_pipeline",
    code_ref="pipelines/churn_features.py"
)

# Reports / consumers
lg.add_transformation(
    inputs=["warehouse.mart_daily_revenue"],
    output="dashboard.revenue_tracker",
    step_name="Revenue Dashboard", step_type="bi_report",
    code_ref="looker/dashboards/revenue_tracker.lookml"
)
lg.add_transformation(
    inputs=["feature_store.churn_features"],
    output="model.churn_prediction_v3",
    step_name="Churn Model Training", step_type="ml_training"
)

# ── Use the lineage graph ─────────────────────────────────────────
print("Upstream of churn model:")
print(lg.get_upstream("model.churn_prediction_v3"))
# {'postgres.orders', 'postgres.customers', 'salesforce.accounts',
#  'postgres.products', 'mixpanel.events', 'warehouse.stg_orders', ...}

print("\nDownstream of postgres.customers:")
print(lg.get_downstream("postgres.customers"))
# {'warehouse.stg_customers', 'warehouse.fct_sales',
#  'warehouse.mart_customer_summary', 'feature_store.churn_features',
#  'model.churn_prediction_v3'}

print("\nLineage path from postgres.orders to dashboard.revenue_tracker:")
print(lg.get_lineage_path("postgres.orders", "dashboard.revenue_tracker"))
# ['postgres.orders', 'warehouse.stg_orders', 'warehouse.fct_sales',
#  'warehouse.mart_daily_revenue', 'dashboard.revenue_tracker']

# Impact analysis: what happens if postgres.customers changes?
impact = lg.impact_analysis("postgres.customers")Column-Level Lineage: The Deepest Level
Column-level lineage tracks not just which tables feed into which tables, but which specific columns in source tables produced specific columns in output tables.
from dataclasses import dataclass, field
from typing import Optional

@dataclass
class ColumnNode:
    """Represents one column in the column-level lineage graph."""
    table:  str
    column: str

    @property
    def full_name(self) -> str:
        return f"{self.table}.{self.column}"

    def __hash__(self):
        return hash(self.full_name)

    def __eq__(self, other):
        return self.full_name == other.full_name


@dataclass
class ColumnTransformation:
    """Records how output columns are derived from input columns."""
    output: ColumnNode
    inputs: list          # List of ColumnNode
    formula: str          # SQL expression or description
    transform_type: str   # 'direct', 'cast', 'arithmetic', 'aggregate', 'concat', 'condition'


class ColumnLineageTracker:
    """
    Tracks column-level lineage for SQL transformations.
    Answers: 'Which source columns produced this output column?'
    """

    def __init__(self):
        self.mappings: list = []

    def add_mapping(self, output_table: str, output_column: str,
                     input_columns: list,   # list of (table, column) tuples
                     formula: str,
                     transform_type: str = "direct") -> None:
        """Register a column-level transformation."""
        output_node = ColumnNode(table=output_table, column=output_column)
        input_nodes = [ColumnNode(table=t, column=c) for t, c in input_columns]
        self.mappings.append(ColumnTransformation(
            output=output_node,
            inputs=input_nodes,
            formula=formula,
            transform_type=transform_type
        ))

    def get_column_ancestry(self, table: str, column: str) -> list:
        """
        Get all source columns that contributed to a given output column.
        Recursively traces back through all transformation steps.
        """
        target = ColumnNode(table=table, column=column)
        visited = set()
        ancestors = []

        def trace_back(node: ColumnNode):
            if node.full_name in visited:
                return
            visited.add(node.full_name)

            for mapping in self.mappings:
                if mapping.output == node:
                    for input_node in mapping.inputs:
                        ancestors.append({
                            "source":     input_node.full_name,
                            "output":     node.full_name,
                            "formula":    mapping.formula,
                            "transform":  mapping.transform_type
                        })
                        trace_back(input_node)

        trace_back(target)
        return ancestors

    def get_column_impact(self, table: str, column: str) -> list:
        """
        Get all output columns that depend on a given source column.
        Answers: 'If I change this column, what else breaks?'
        """
        source = ColumnNode(table=table, column=column)
        impacts = []

        def trace_forward(node: ColumnNode):
            for mapping in self.mappings:
                if node in mapping.inputs:
                    impacts.append({
                        "source":   node.full_name,
                        "output":   mapping.output.full_name,
                        "formula":  mapping.formula
                    })
                    trace_forward(mapping.output)

        trace_forward(source)
        return impacts


# Build column-level lineage for the revenue calculation
clt = ColumnLineageTracker()

# raw_orders → stg_orders
clt.add_mapping("stg_orders", "order_id",
    [("raw_orders", "id")],
    "CAST(id AS TEXT)", transform_type="cast")

clt.add_mapping("stg_orders", "quantity",
    [("raw_orders", "item_quantity")],
    "COALESCE(item_quantity, 0)", transform_type="direct")

clt.add_mapping("stg_orders", "unit_price_usd",
    [("raw_orders", "unit_price"), ("raw_orders", "currency")],
    "CASE WHEN currency='EUR' THEN unit_price * 1.08 ELSE unit_price END",
    transform_type="condition")

# stg_orders → fct_sales
clt.add_mapping("fct_sales", "line_revenue",
    [("stg_orders", "quantity"), ("stg_orders", "unit_price_usd")],
    "quantity * unit_price_usd", transform_type="arithmetic")

# fct_sales → mart_customer_summary
clt.add_mapping("mart_customer_summary", "lifetime_value",
    [("fct_sales", "line_revenue")],
    "SUM(line_revenue) GROUP BY customer_id", transform_type="aggregate")

# Trace: where does lifetime_value come from, all the way back?
print("Column ancestry for mart_customer_summary.lifetime_value:")
for step in clt.get_column_ancestry("mart_customer_summary", "lifetime_value"):
    print(f"  {step['source']} ──[{step['transform']}]──► {step['output']}")
    print(f"    Formula: {step['formula']}")

# Impact: if we change raw_orders.unit_price, what breaks?
print("\nImpact of changing raw_orders.unit_price:")
for impact in clt.get_column_impact("raw_orders", "unit_price"):
print(f" → {impact['output']}")Why Lineage Matters for Data Scientists: Practical Scenarios
Scenario 1: Debugging a Wrong Metric
# You notice the revenue dashboard shows $1.2M but last week it was $1.1M
# The business says nothing changed — is this a data bug or a real change?

def debug_metric_with_lineage(lg: LineageGraph, metric_dataset: str):
    """
    Use lineage to systematically narrow down the source of a metric change.
    """
    print(f"Debugging unexpected change in: {metric_dataset}")
    print(f"\nStep 1: Trace all upstream data sources")

    upstream = lg.get_upstream(metric_dataset)
    print(f"  {len(upstream)} upstream datasets:")
    for ds in sorted(upstream):
        print(f"  → {ds}")

    print(f"\nStep 2: Check each upstream for recent changes")
    # In a real system, you'd query pipeline run logs or audit tables
    # to find which upstream datasets changed recently

    print(f"\nStep 3: Find the lineage path for the suspicious column")
    # Use column-level lineage to trace back to the raw source

return upstreamScenario 2: Assessing the Risk of an Upstream Schema Change
def schema_change_impact_report(lg: LineageGraph,
                                  changed_dataset: str) -> dict:
    """
    Generate an impact report before making a schema change.
    Shows every downstream asset that will be affected.
    """
    downstream = lg.get_downstream(changed_dataset)

    # Categorize by type
    report = {
        "changed_dataset":   changed_dataset,
        "total_affected":    len(downstream),
        "affected_by_type":  {},
        "affected_list":     []
    }

    for ds in downstream:
        ds_type = lg.graph.nodes[ds].get("type", "unknown")
        if ds_type not in report["affected_by_type"]:
            report["affected_by_type"][ds_type] = []
        report["affected_by_type"][ds_type].append(ds)
        report["affected_list"].append(ds)

    print(f"\nSchema Change Impact Report")
    print(f"Changed dataset: {changed_dataset}")
    print(f"Total downstream affected: {len(downstream)}")
    print(f"\nBy type:")
    for dtype, dsets in report["affected_by_type"].items():
        print(f"  {dtype} ({len(dsets)}): {dsets}")

return reportScenario 3: Model Reproducibility
# To reproduce a model from 6 months ago, you need to know:
# 1. Exactly which source tables were used (provenance)
# 2. Which transformations were applied (lineage)
# 3. What the data looked like at training time (version)

def create_model_training_manifest(
    model_name:     str,
    model_version:  str,
    input_datasets: list,  # List of (dataset_name, version_or_snapshot_date)
    feature_list:   list,
    target_column:  str,
    training_date:  str
) -> dict:
    """
    Create a complete reproducibility manifest for a trained model.
    Save this alongside the model artifact for future reference.
    """
    manifest = {
        "model_name":      model_name,
        "model_version":   model_version,
        "trained_at":      training_date,
        "target_column":   target_column,
        "feature_count":   len(feature_list),
        "features":        feature_list,
        "input_datasets":  [
            {"name": name, "snapshot": snapshot}
            for name, snapshot in input_datasets
        ],
        "lineage": {
            "provenance_files": [
                f"lineage/{name.replace('.', '_')}_lineage.json"
                for name, _ in input_datasets
            ],
            "feature_pipeline_version": "churn_features_v2.1.3",
            "feature_pipeline_code":    "pipelines/churn_features.py",
            "git_commit":               "a3f8d2e"
        }
    }

    return manifest

manifest = create_model_training_manifest(
    model_name     = "customer_churn_classifier",
    model_version  = "v3.2",
    input_datasets = [
        ("warehouse.mart_customer_summary", "2024-09-14T06:00:00Z"),
        ("feature_store.churn_features",    "2024-09-14T07:30:00Z")
    ],
    feature_list   = ["lifetime_value", "recency_days", "n_orders",
                       "avg_order_value", "n_high_severity_tickets"],
    target_column  = "churned_30d",
    training_date  = "2024-09-15T10:00:00Z"
)
print(json.dumps(manifest, indent=2))Compliance and Regulatory Lineage
For regulated industries (healthcare, finance, insurance), lineage is not optional — it is a compliance requirement.
# GDPR Article 30 requires maintaining records of processing activities:
# what data, from where, processed how, for what purpose, by whom

@dataclass
class ComplianceLineageRecord:
    """
    Data processing record for GDPR Article 30 compliance.
    Documents every data processing activity involving personal data.
    """
    processing_activity:  str
    personal_data_types:  list   # e.g., ['name', 'email', 'location']
    data_subjects:        str    # e.g., 'EU customers'
    legal_basis:          str    # 'consent', 'contract', 'legitimate_interest', 'legal_obligation'
    purpose:              str
    data_sources:         list
    data_recipients:      list
    retention_period:     str
    third_country_transfer: bool = False
    security_measures:    list = field(default_factory=list)
    created_at:           str = field(
        default_factory=lambda: datetime.now(timezone.utc).isoformat()
    )

# Example: documenting ML model training involving personal data
training_record = ComplianceLineageRecord(
    processing_activity   = "Churn prediction model training",
    personal_data_types   = ["email", "purchase_history", "account_status"],
    data_subjects         = "Registered customers in EU",
    legal_basis           = "legitimate_interest",
    purpose               = "Predicting customer churn to improve retention offers",
    data_sources          = ["analytics_warehouse.dim_customer",
                              "analytics_warehouse.fact_sales"],
    data_recipients       = ["data-science-team", "marketing-analytics"],
    retention_period      = "Model artifact: 2 years. Training data: not stored separately.",
    third_country_transfer= False,
    security_measures     = [
        "Data access restricted to authorized pipeline service accounts",
        "Customer IDs pseudonymized in model outputs",
        "Data not used for individual profiling in model outputs"
    ]
)Best Practices for Provenance and Lineage
1. Write Provenance as You Go
The hardest part of provenance is capturing it — not analyzing it afterward. Build provenance recording into every pipeline step:
def with_provenance(func):
    """Decorator that automatically records provenance for pipeline functions."""
    import functools
    import time

    @functools.wraps(func)
    def wrapper(*args, **kwargs):
        start = time.time()
        result = func(*args, **kwargs)
        duration = time.time() - start

        # Auto-record basic provenance
        if hasattr(result, '__len__'):
            print(f"[Provenance] {func.__name__}: {len(result):,} rows in {duration:.1f}s")

        return result
return wrapper2. Use dbt for SQL Transformation Lineage
If your team uses SQL for transformations, dbt provides automatic lineage for free. The {{ ref() }} pattern is both a dependency declaration and a lineage record.
3. Version Your Datasets
When creating datasets that will be used for model training, save a version identifier (snapshot date, Git commit, pipeline version):
import pandas as pd
from datetime import datetime, timezone

def save_versioned_dataset(df: pd.DataFrame,
                            base_path: str,
                            dataset_name: str) -> str:
    """
    Save a dataset with a version timestamp in the filename.
    Returns the full path for provenance recording.
    """
    version = datetime.now(timezone.utc).strftime("%Y%m%d_%H%M%S")
    filepath = f"{base_path}/{dataset_name}_{version}.parquet"
    df.to_parquet(filepath, index=False)

    # Also save 'latest' symlink/copy for convenience
    latest_path = f"{base_path}/{dataset_name}_latest.parquet"
    df.to_parquet(latest_path, index=False)

    print(f"Saved: {filepath} ({len(df):,} rows)")
return filepath4. Document Column Meanings
Lineage tells you where a column came from. Documentation tells you what it means. Both are necessary for trustworthy data:
# Column documentation template — maintain alongside the dataset
FEATURE_DOCS = {
    "lifetime_value": {
        "description": "Sum of all completed order amounts in USD for this customer, all time",
        "source":       "SUM(fct_sales.line_revenue) for completed orders",
        "unit":         "USD",
        "nullable":     False,
        "business_rule": "Excludes cancelled and refunded orders. Includes tax if charged."
    },
    "recency_days": {
        "description": "Calendar days between the customer's most recent order and the reference date",
        "source":       "reference_date - MAX(fct_sales.order_date)",
        "unit":         "days",
        "nullable":     False,
        "business_rule": "999 for customers who have never ordered. Never negative."
    },
    "n_high_severity_tickets": {
        "description": "Count of support tickets with severity='high' in the lookback period",
        "source":       "SUM(CASE WHEN fact_support_tickets.severity='high' THEN 1 ELSE 0 END)",
        "unit":         "count",
        "nullable":     False,
        "business_rule": "Lookback period defined in CONFIG['lookback_days'] (default: 365 days)"
    }
}Summary
Data provenance and lineage are the infrastructure of trust in data-driven organizations. Provenance answers where data came from and how it was collected — essential for assessing trustworthiness, satisfying compliance requirements, and enabling reproducibility. Lineage answers what path the data took and what transformations were applied — essential for debugging wrong numbers, assessing the impact of upstream changes, and understanding what a model was actually trained on.
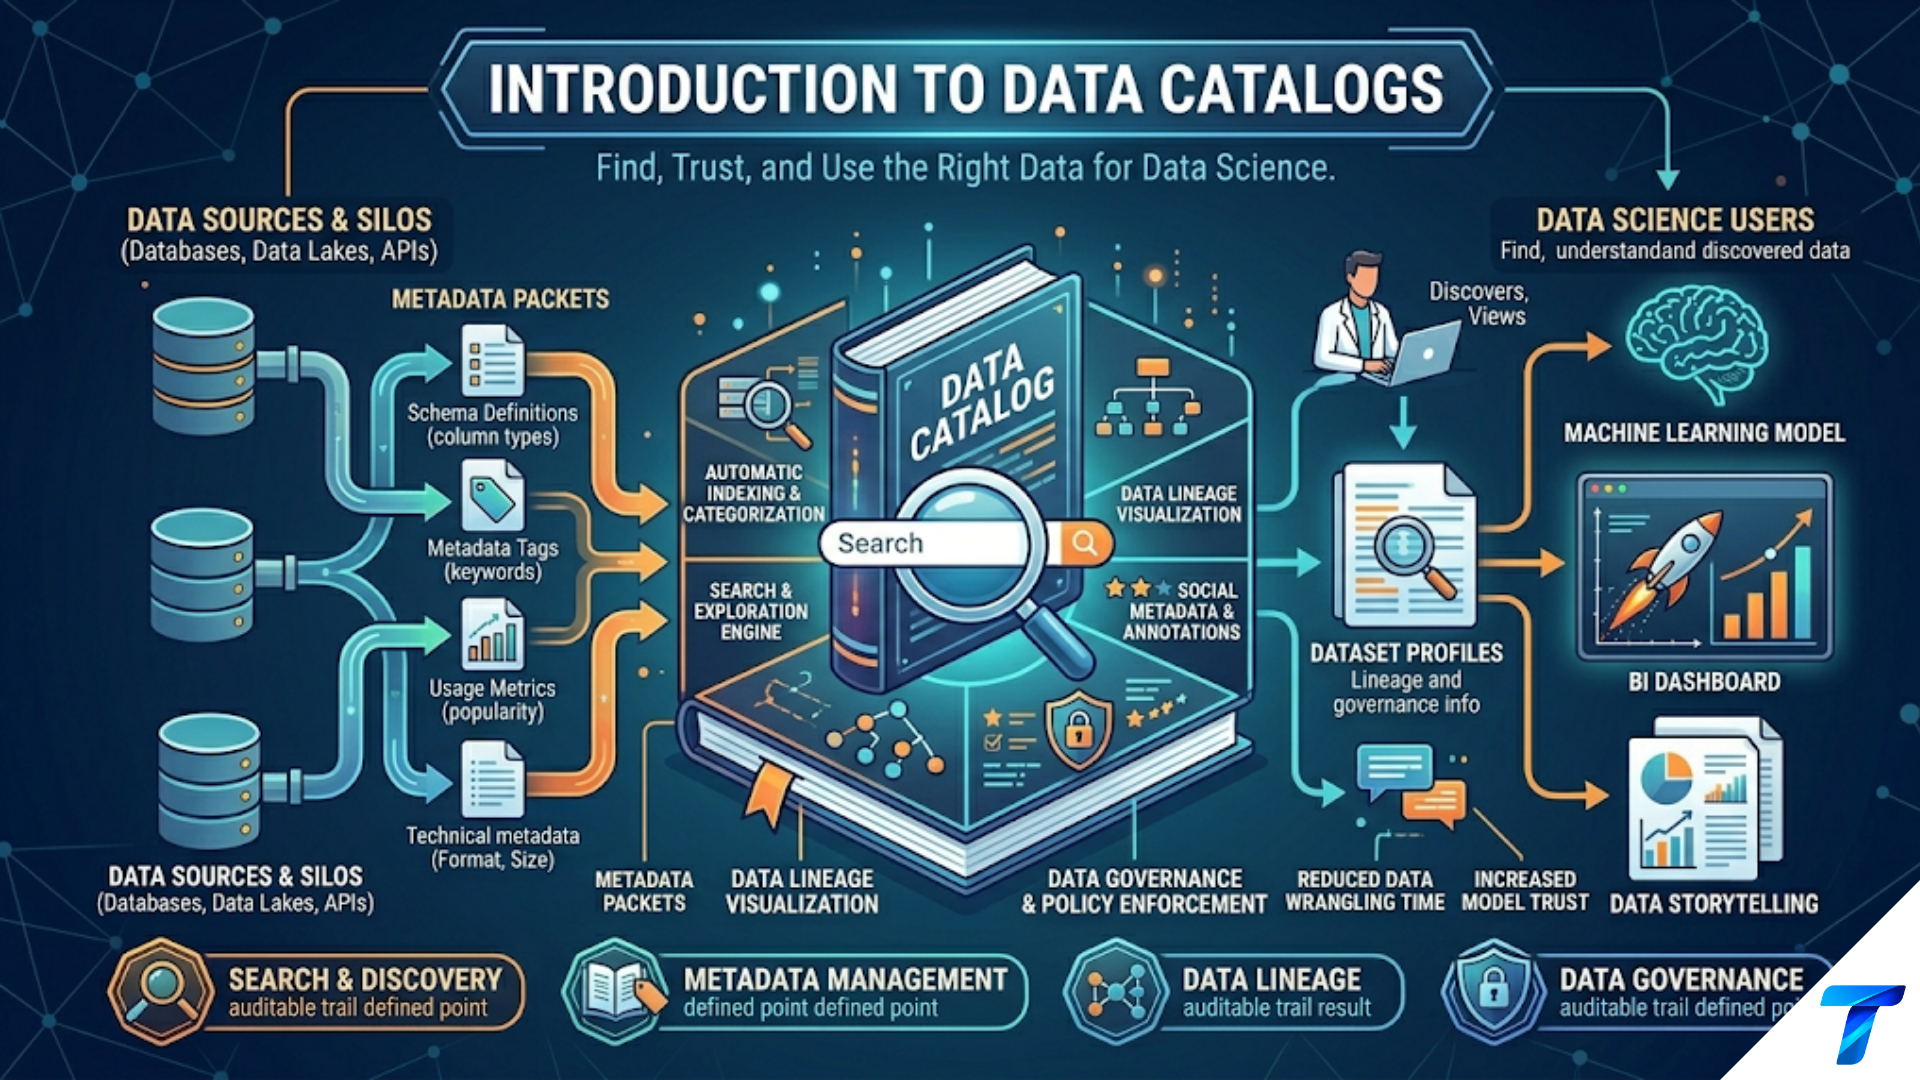
Modern data tools make lineage increasingly automatic: dbt generates table-level lineage from {{ ref() }} dependencies, OpenLineage provides a standard for cross-tool lineage tracking, and data catalogs like Atlan, Alation, and DataHub aggregate lineage from multiple sources. But even without dedicated tooling, data scientists can implement lightweight provenance and lineage practices — documenting data origins in metadata files, tracking column transformations in code, building lineage graphs with NetworkX, and saving versioned datasets — that dramatically improve the debuggability and reproducibility of their work.
The investment in provenance and lineage pays off in the situations that matter most: when a metric is wrong and you need to find why, when a schema change is planned and you need to know what breaks, when a model must be reproduced from six months ago, and when a regulator asks what you did with their constituents’ data.
Key Takeaways
- Data provenance answers “where did this data originate?” — source system, collection method, collection time, known issues; data lineage answers “what happened to this data along the way?” — which tables fed into which, which transformations were applied, which source columns produced which output columns
- Table-level lineage (which tables depend on which tables) is the most common and is provided automatically by dbt through
{{ ref() }}dependencies; column-level lineage (which source columns produced which output columns) is more granular and requires explicit tracking - The two most valuable lineage use cases for data scientists are root cause analysis (tracing a wrong metric back to its source) and impact analysis (understanding which downstream assets break when an upstream dataset changes)
- Model reproducibility requires recording provenance at training time: exactly which dataset versions, which features, which pipeline code version, and which date snapshot produced a specific model artifact
- OpenLineage is the open standard for emitting lineage events across tools (Spark, Airflow, dbt, Flink) to a central lineage store; tools like Marquez, Atlan, DataHub, and Apache Atlas provide the storage and visualization layer
- For regulated industries, data lineage is a compliance requirement — GDPR Article 30 requires documenting what personal data is processed, from where, for what purpose, and under what legal basis
- Even without dedicated lineage tooling, lightweight practices provide most of the value:
DataProvenancemetadata files alongside each dataset,DatasetLineageJSON records for each pipeline step, versioned dataset filenames, and column-level documentation - The
LineageGraphpattern — tracking datasets as nodes and transformations as edges in a directed acyclic graph — enables programmatic impact analysis, root cause tracing, and lineage path discovery without requiring commercial tooling