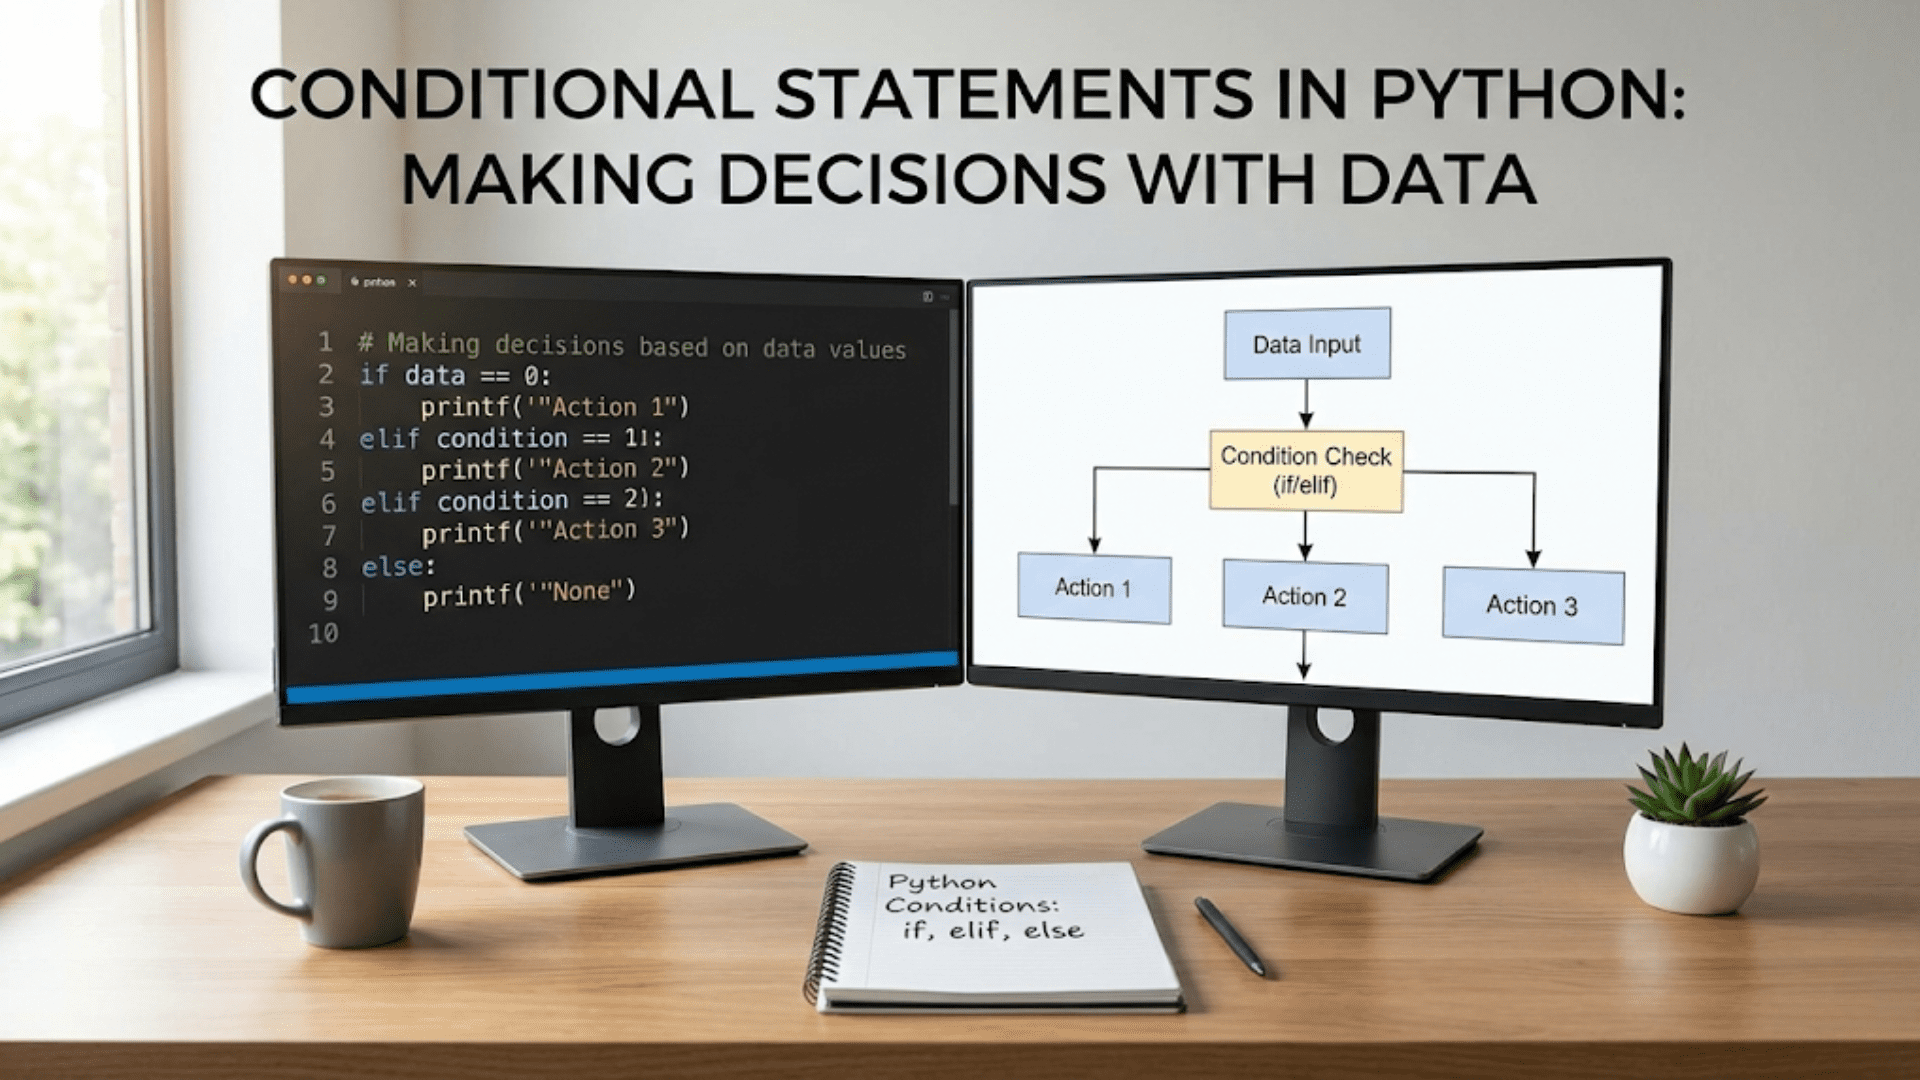
Conditional Statements in Python: Making Decisions with Data
Master Python conditional statements for data science. Learn if, elif, and else with practical examples…
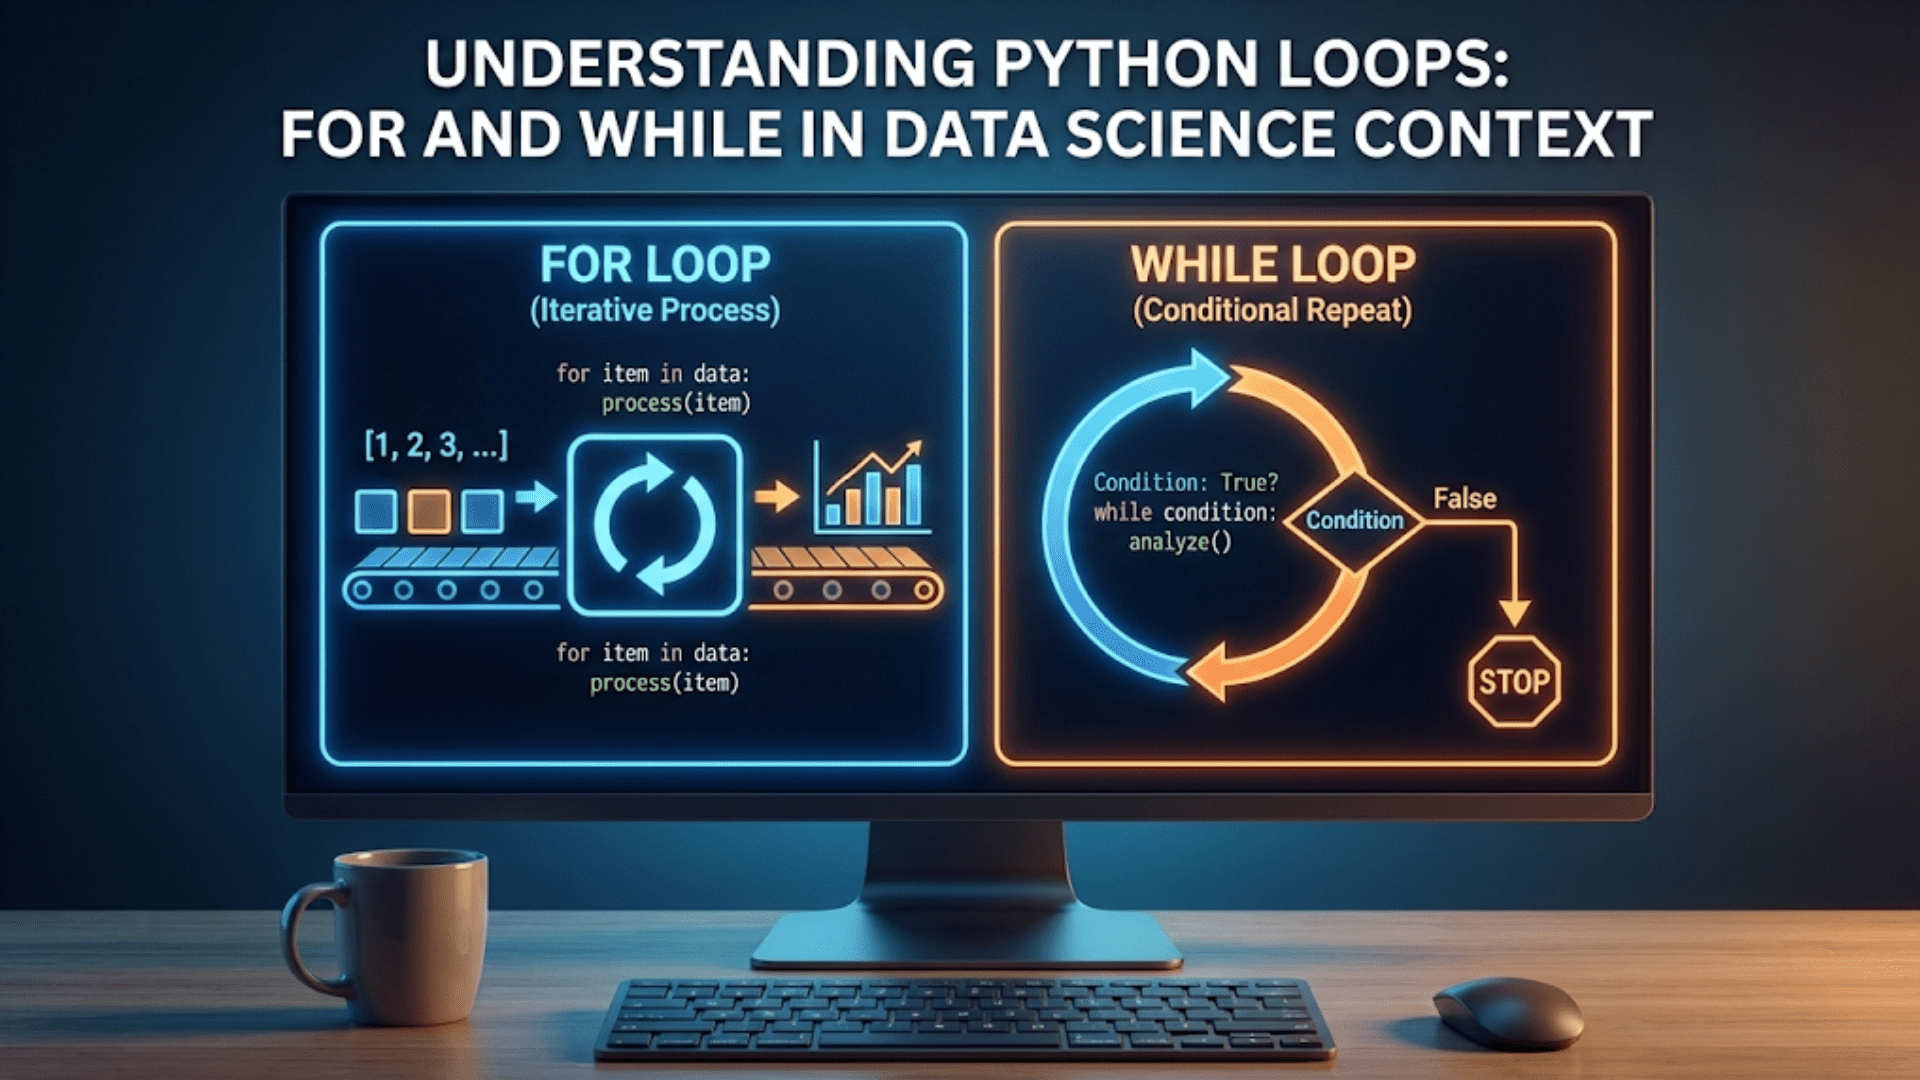
Understanding Python Loops: For and While in Data Science Context
Master Python for and while loops for data science. Learn to iterate through data, process…
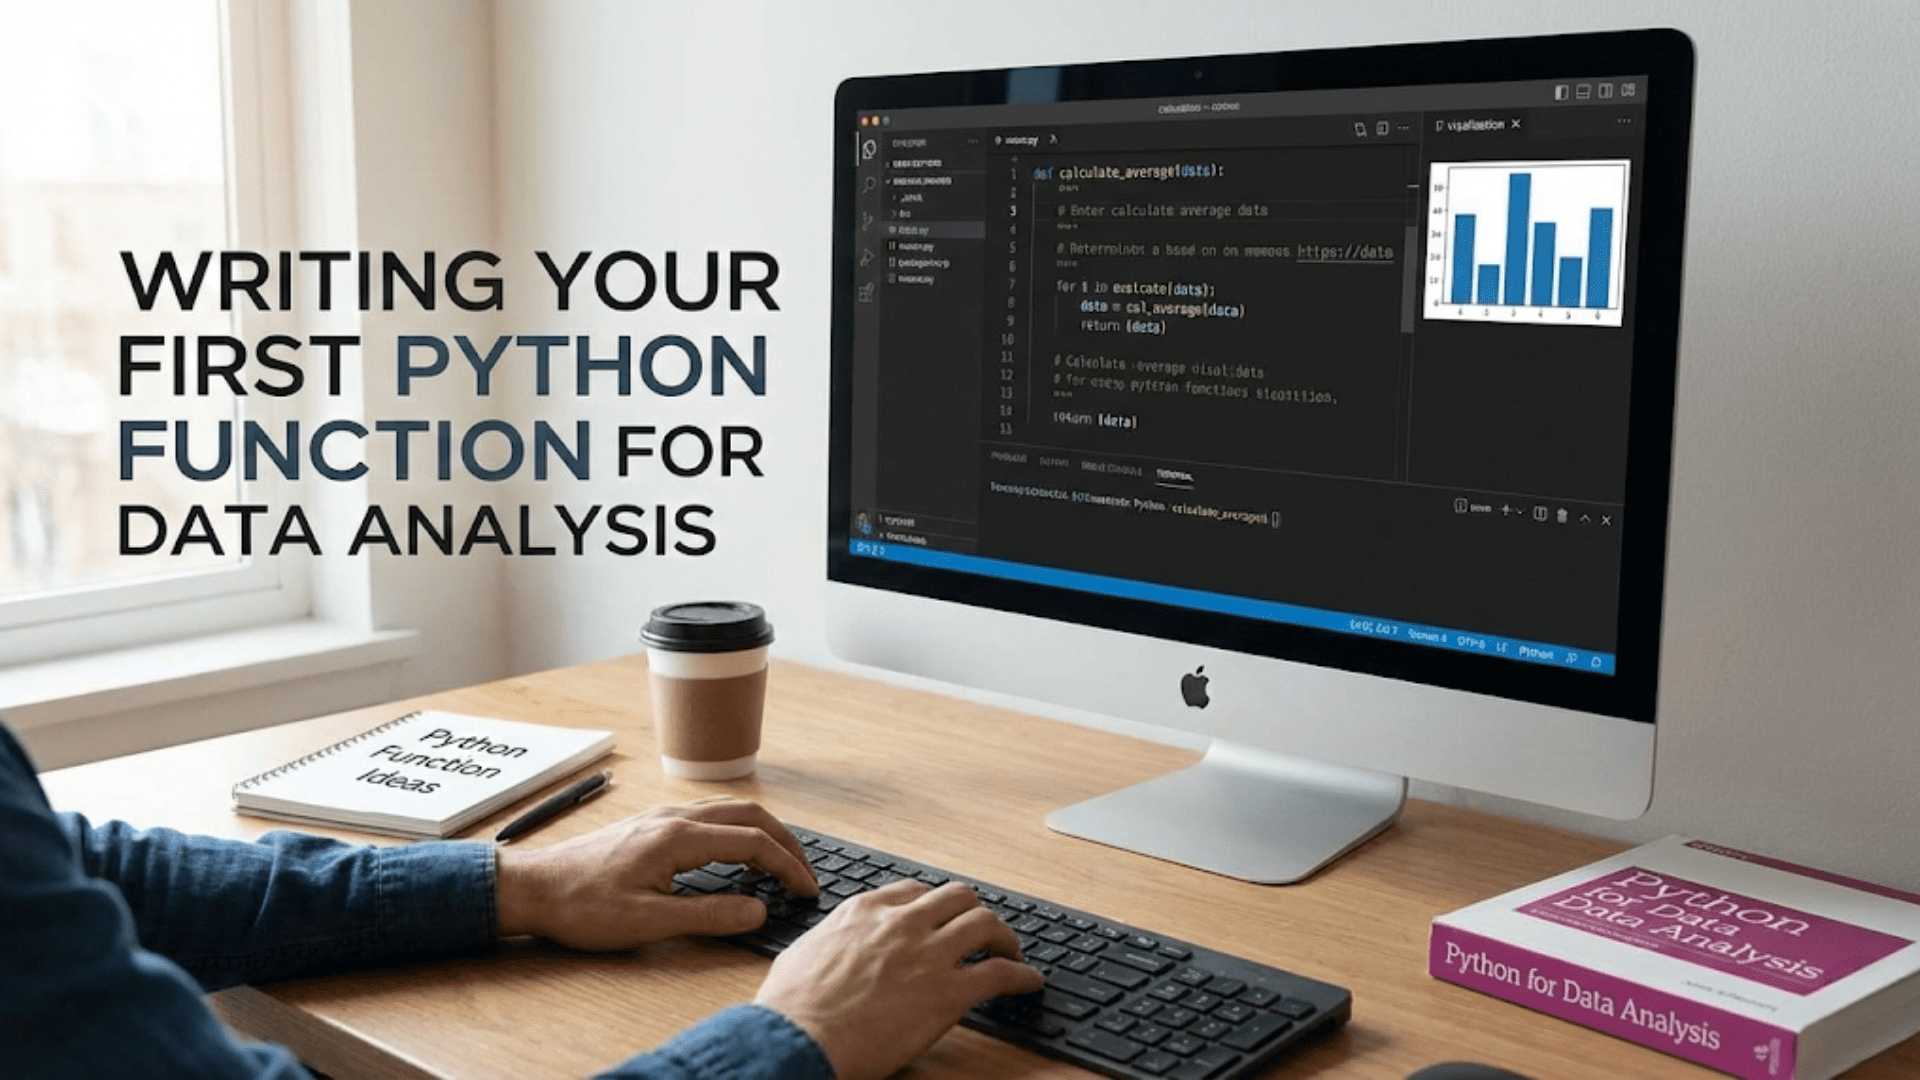
Writing Your First Python Function for Data Analysis
Learn to write Python functions for data analysis from scratch. Master function basics, parameters, return…
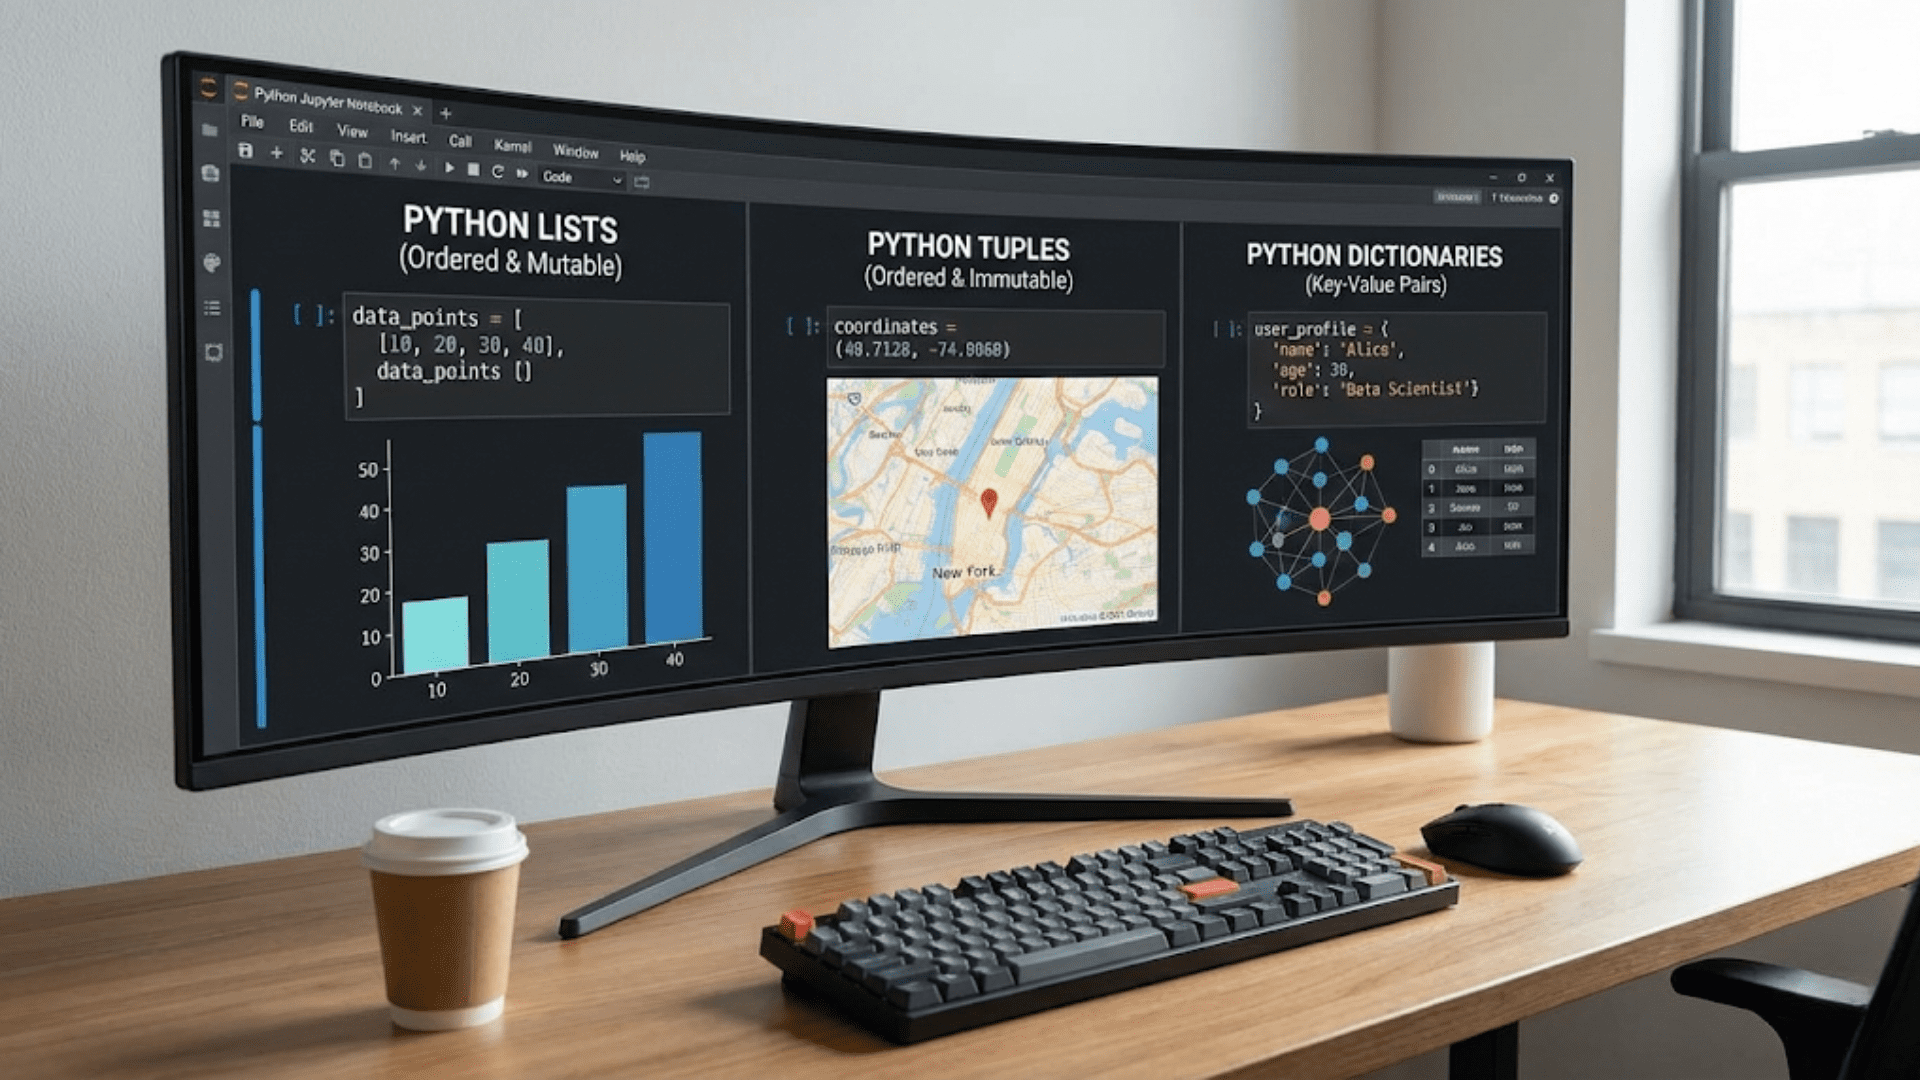
Python Lists, Tuples, and Dictionaries for Data Science
Master Python’s essential data structures: lists, tuples, and dictionaries. Learn when to use each structure…
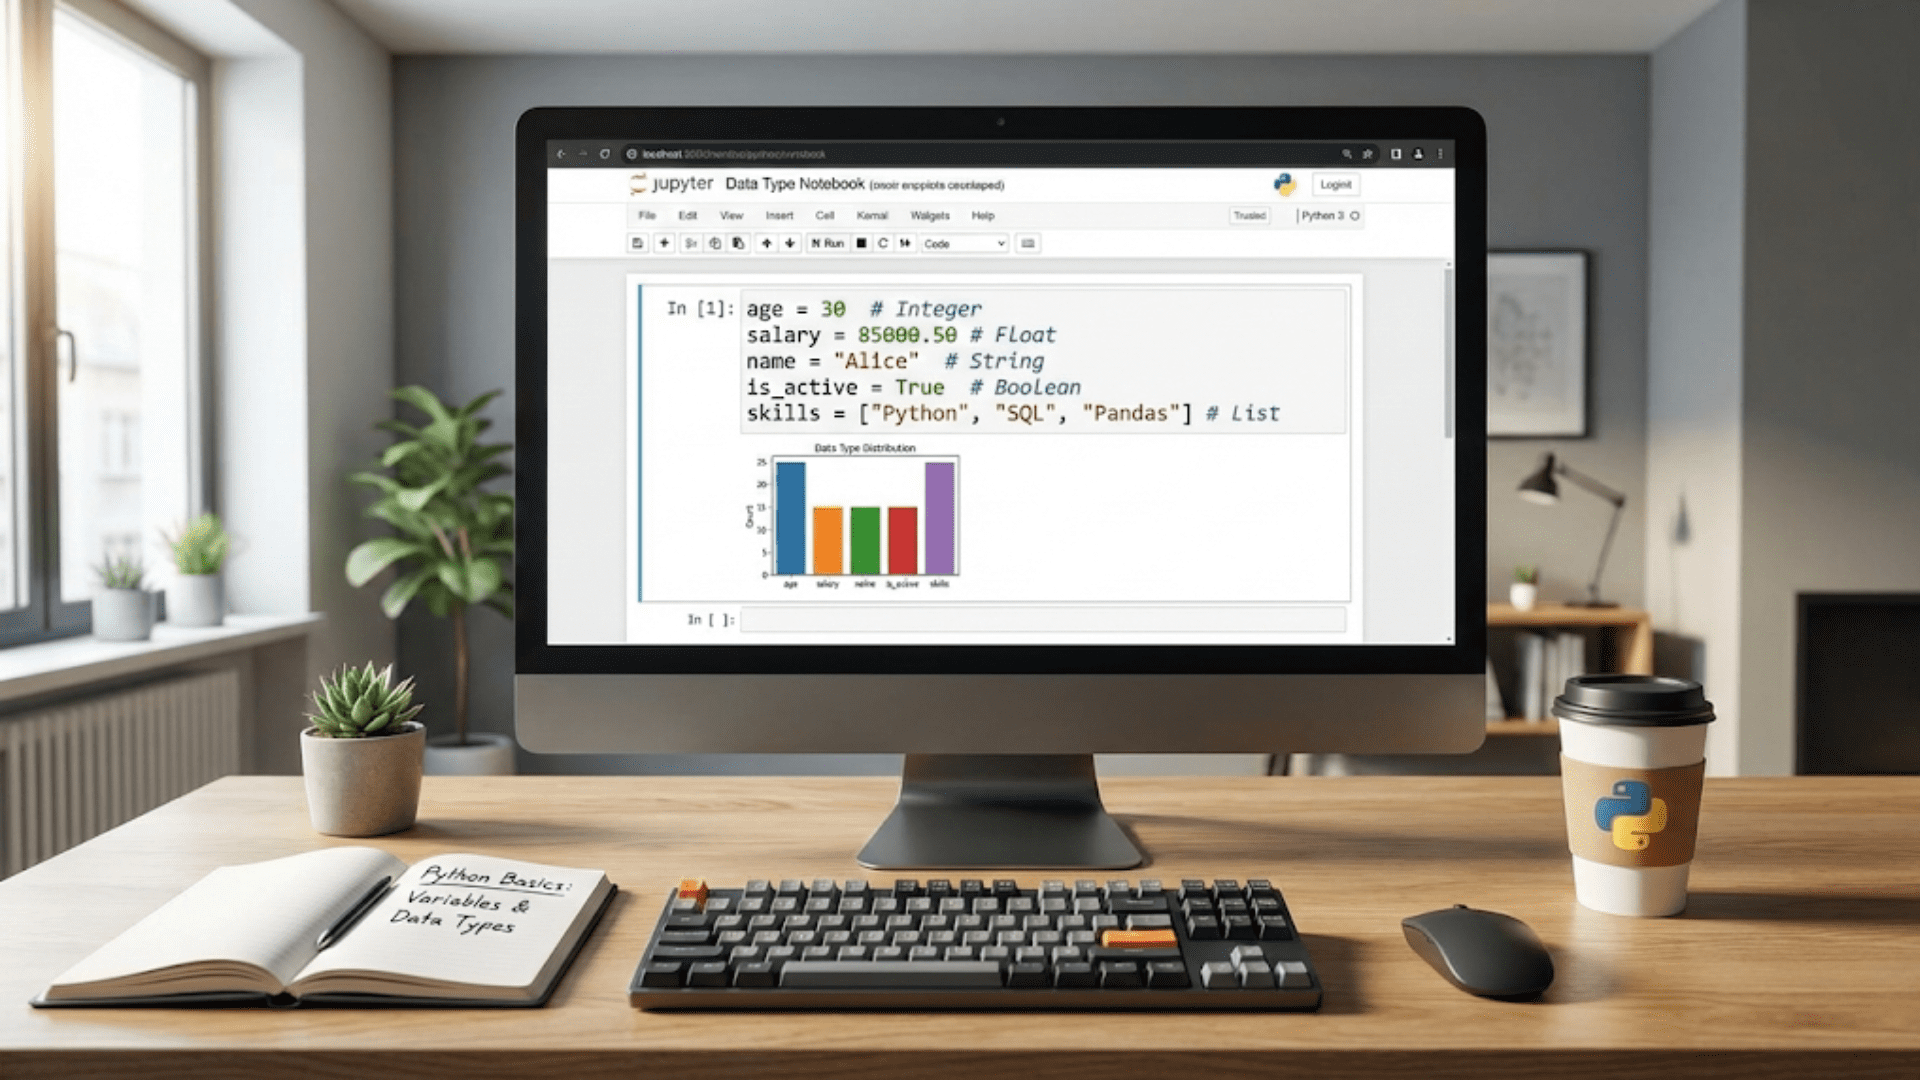
Python Basics for Data Science: Variables and Data Types
Master Python fundamentals for data science. Learn variables and data types with practical examples. Perfect…
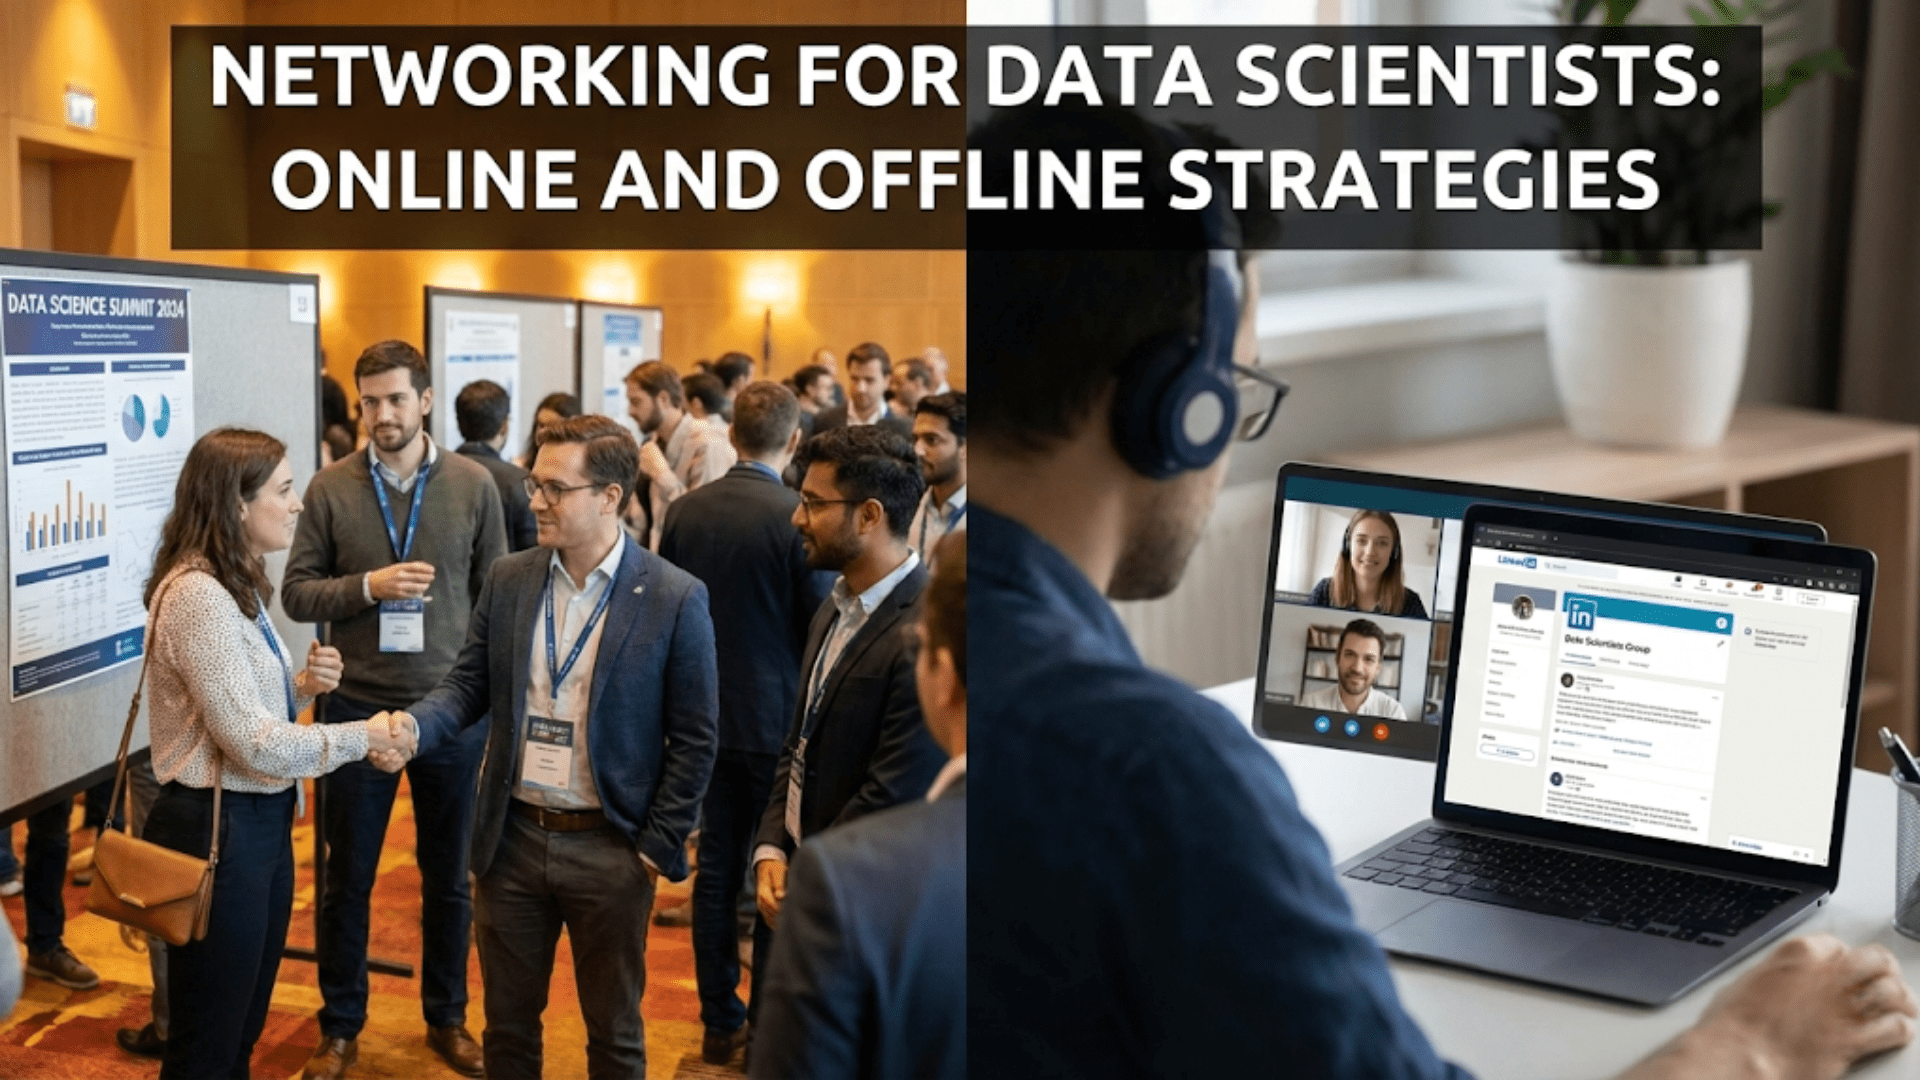
Networking for Data Scientists: Online and Offline Strategies
Master networking as a data scientist with proven strategies for building meaningful professional connections online…

Building a Personal Brand as a Data Scientist
Learn how to build a strong personal brand as a data scientist. Discover strategies for…

The Difference Between Junior, Mid-Level, and Senior Data Scientists
Understand the real differences between junior, mid-level, and senior data scientists. Learn what skills, responsibilities,…

Data Science Salaries by Experience Level and Location
Comprehensive analysis of data science salaries by experience level and location. Understand what data scientists…

Freelancing as a Data Scientist: Getting Started
Start your data science freelancing career with this complete guide. Learn how to find clients,…

Finding Your First Data Science Job: Strategies That Work
Land your first data science job with proven strategies that work. Learn how to position…
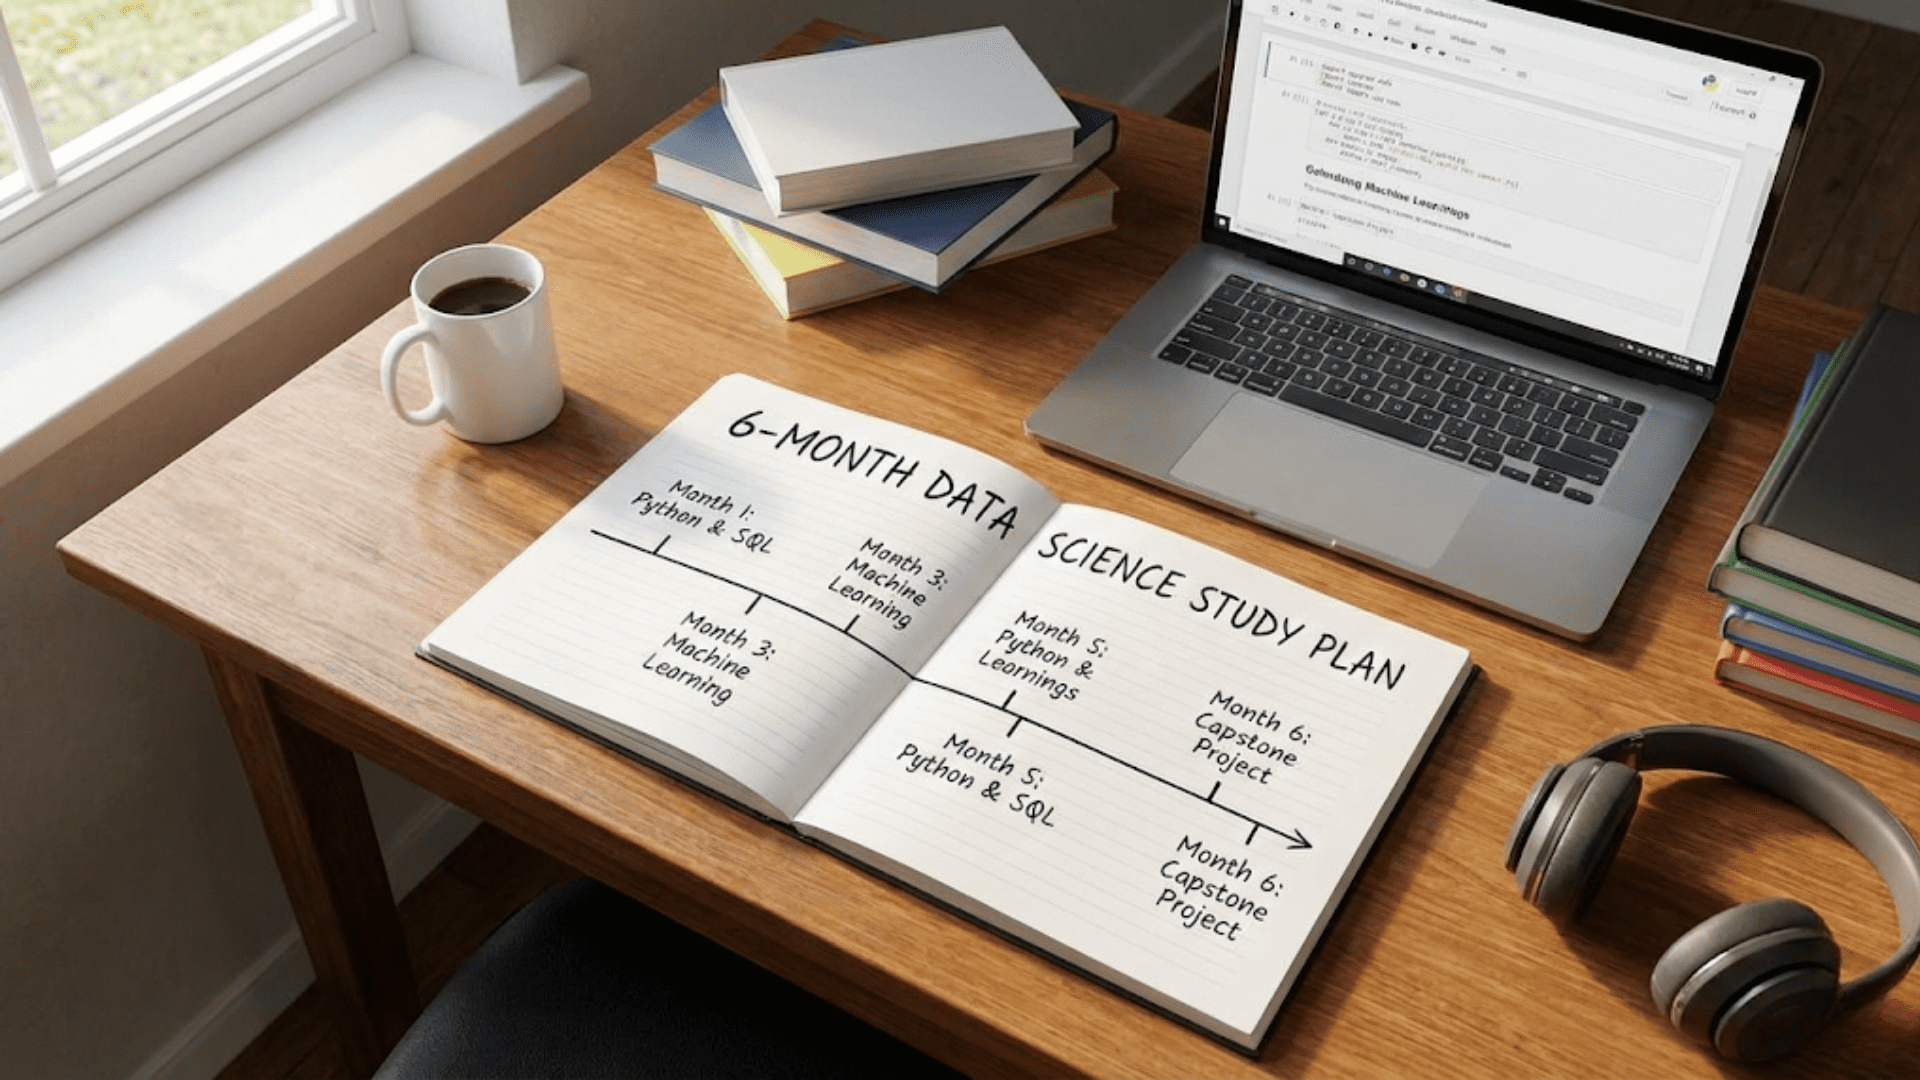
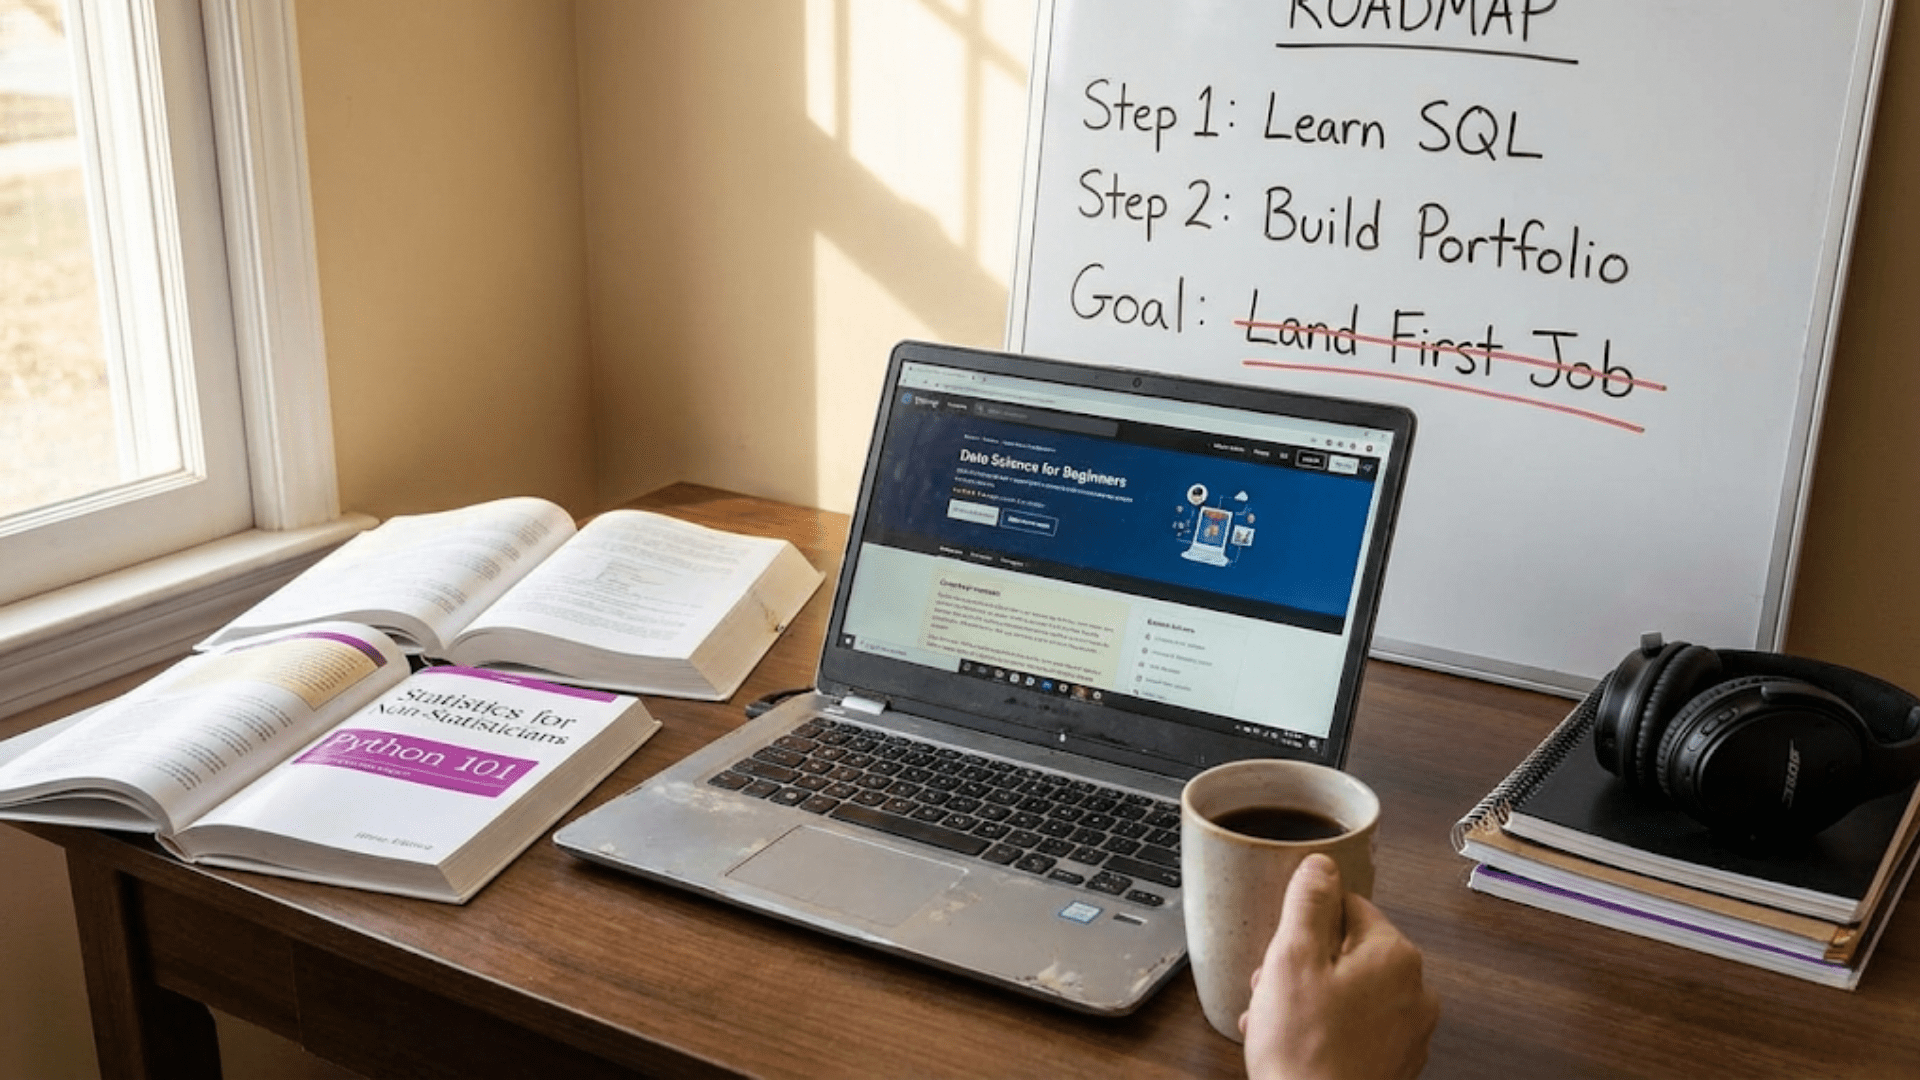
Self-Teaching Data Science: A 6-Month Study Plan
Master data science on your own with this detailed 6-month study plan. Week-by-week guidance covering…
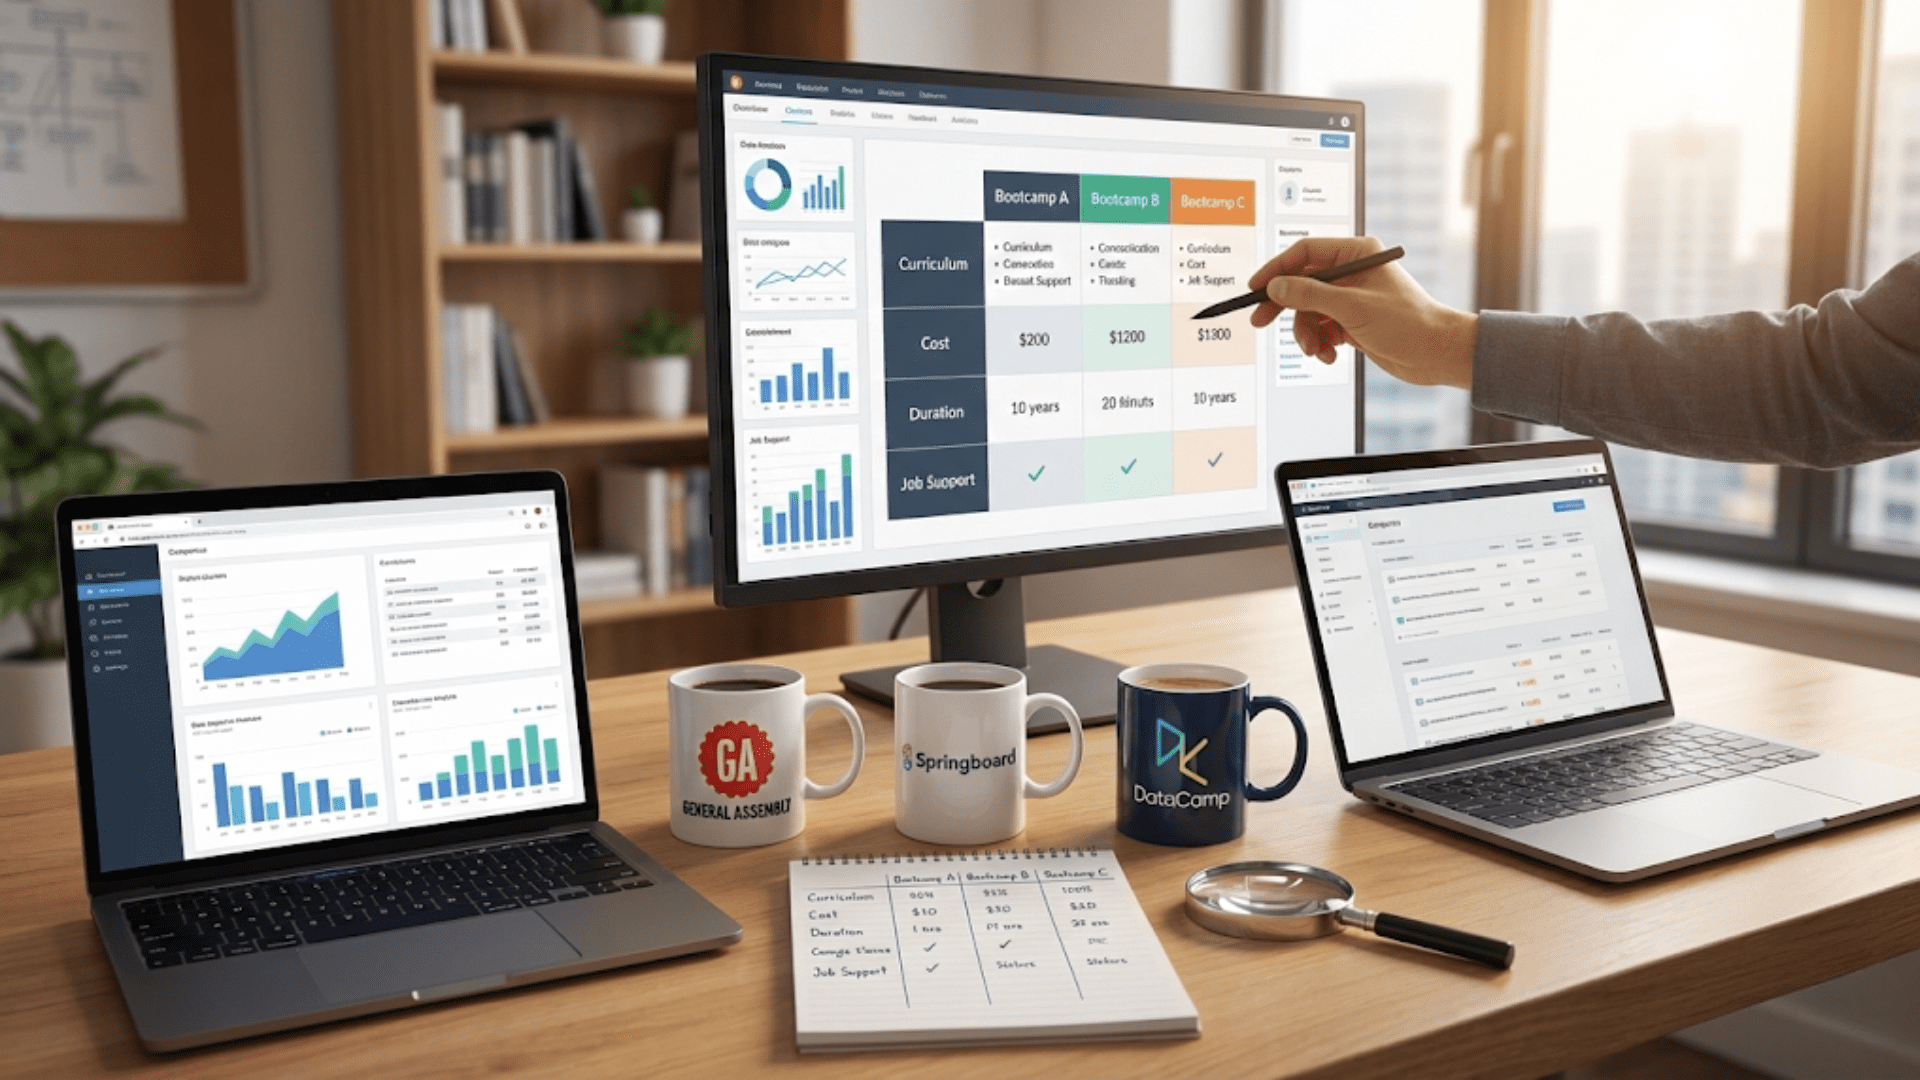
Top Data Science Bootcamps Compared: Which is Right for You?
Compare top data science bootcamps including curriculum, cost, outcomes, and learning formats. Discover which bootcamp…
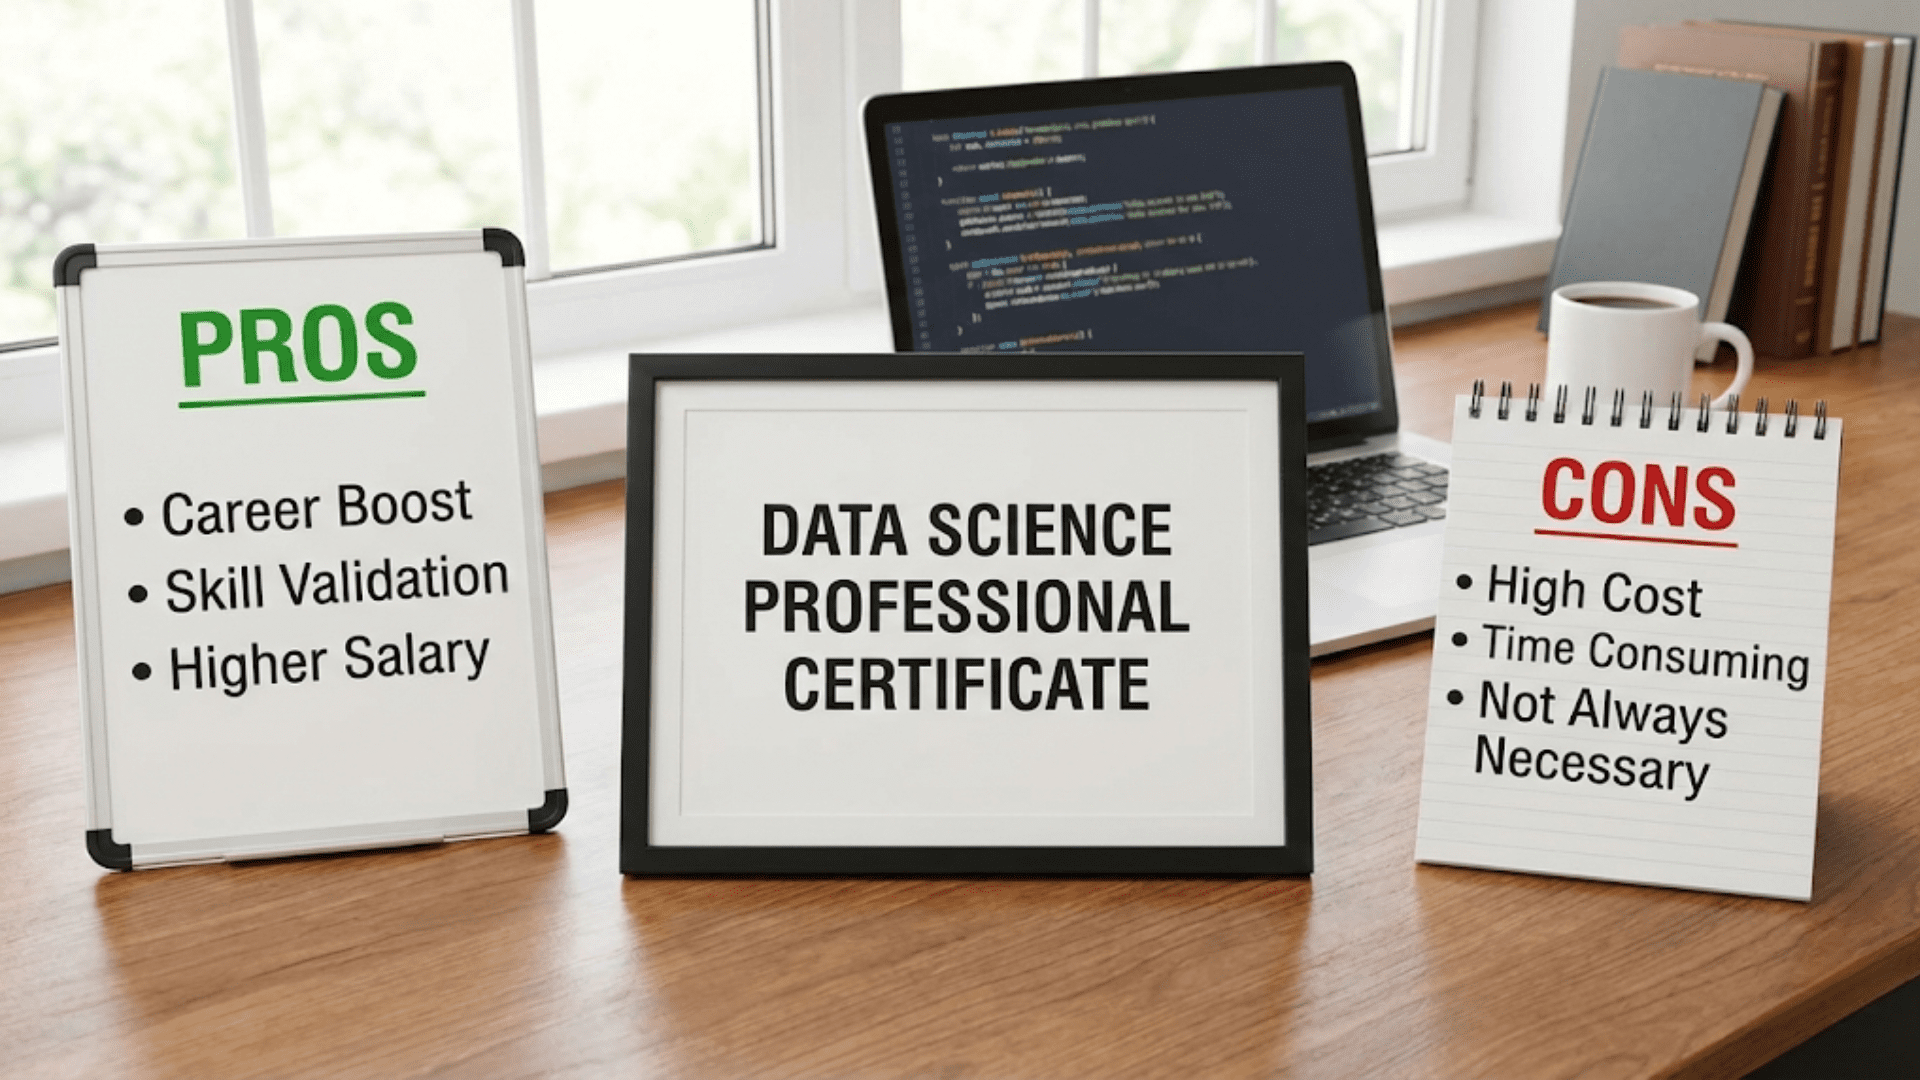
Should You Get a Data Science Certification? Pros and Cons
Discover whether data science certifications are worth your time and money. Learn about the pros…

How to Answer “Tell Me About a Data Science Project” in Interviews
Master the art of presenting your data science projects in interviews. Learn frameworks for storytelling,…
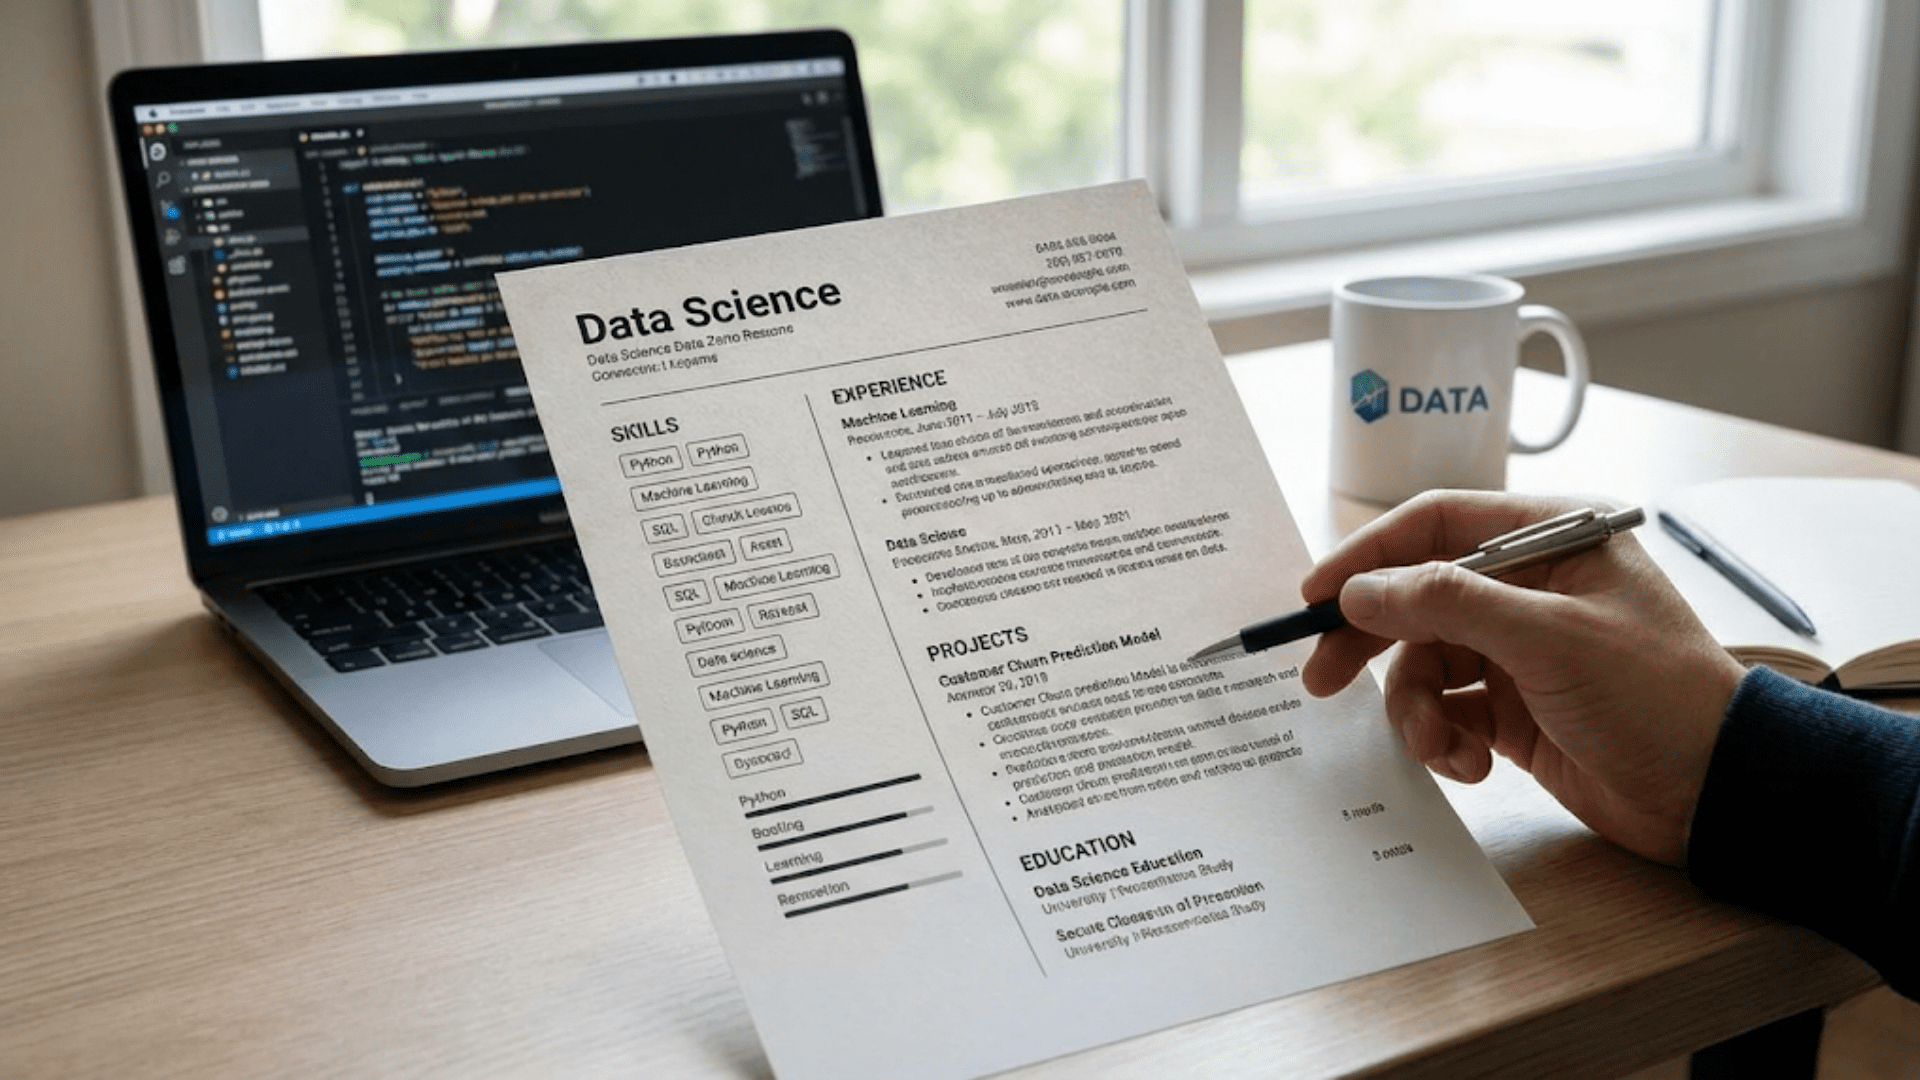
Creating a Data Science Resume That Stands Out
Learn how to create a standout data science resume that catches recruiters’ attention. Discover what…

Preparing for Technical Data Science Interviews
Master technical data science interviews with this comprehensive guide covering live coding sessions, algorithm implementations,…
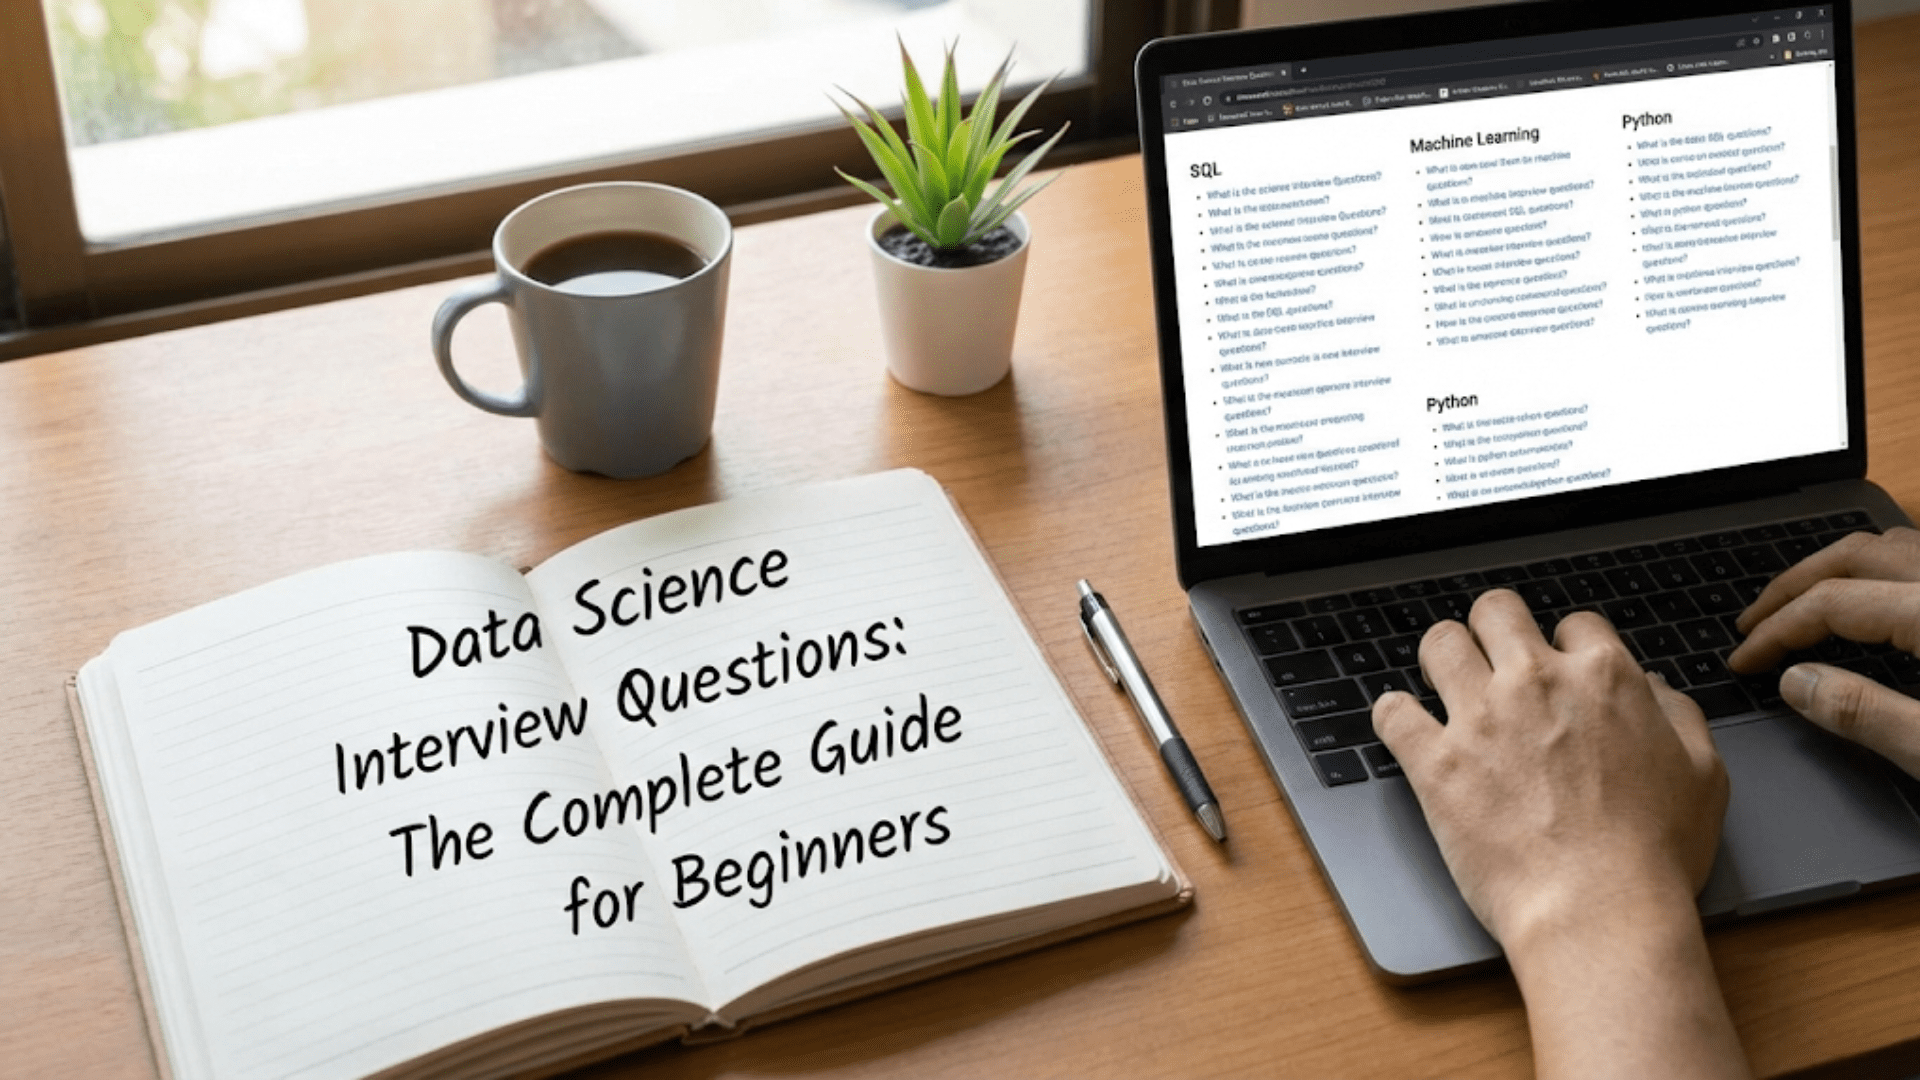
Data Science Interview Questions: The Complete Guide for Beginners
Master data science interviews with this comprehensive guide covering common questions, technical concepts, coding challenges,…
How to Break Into Data Science with No Experience
Learn how to start a data science career from scratch with no prior experience. Discover…
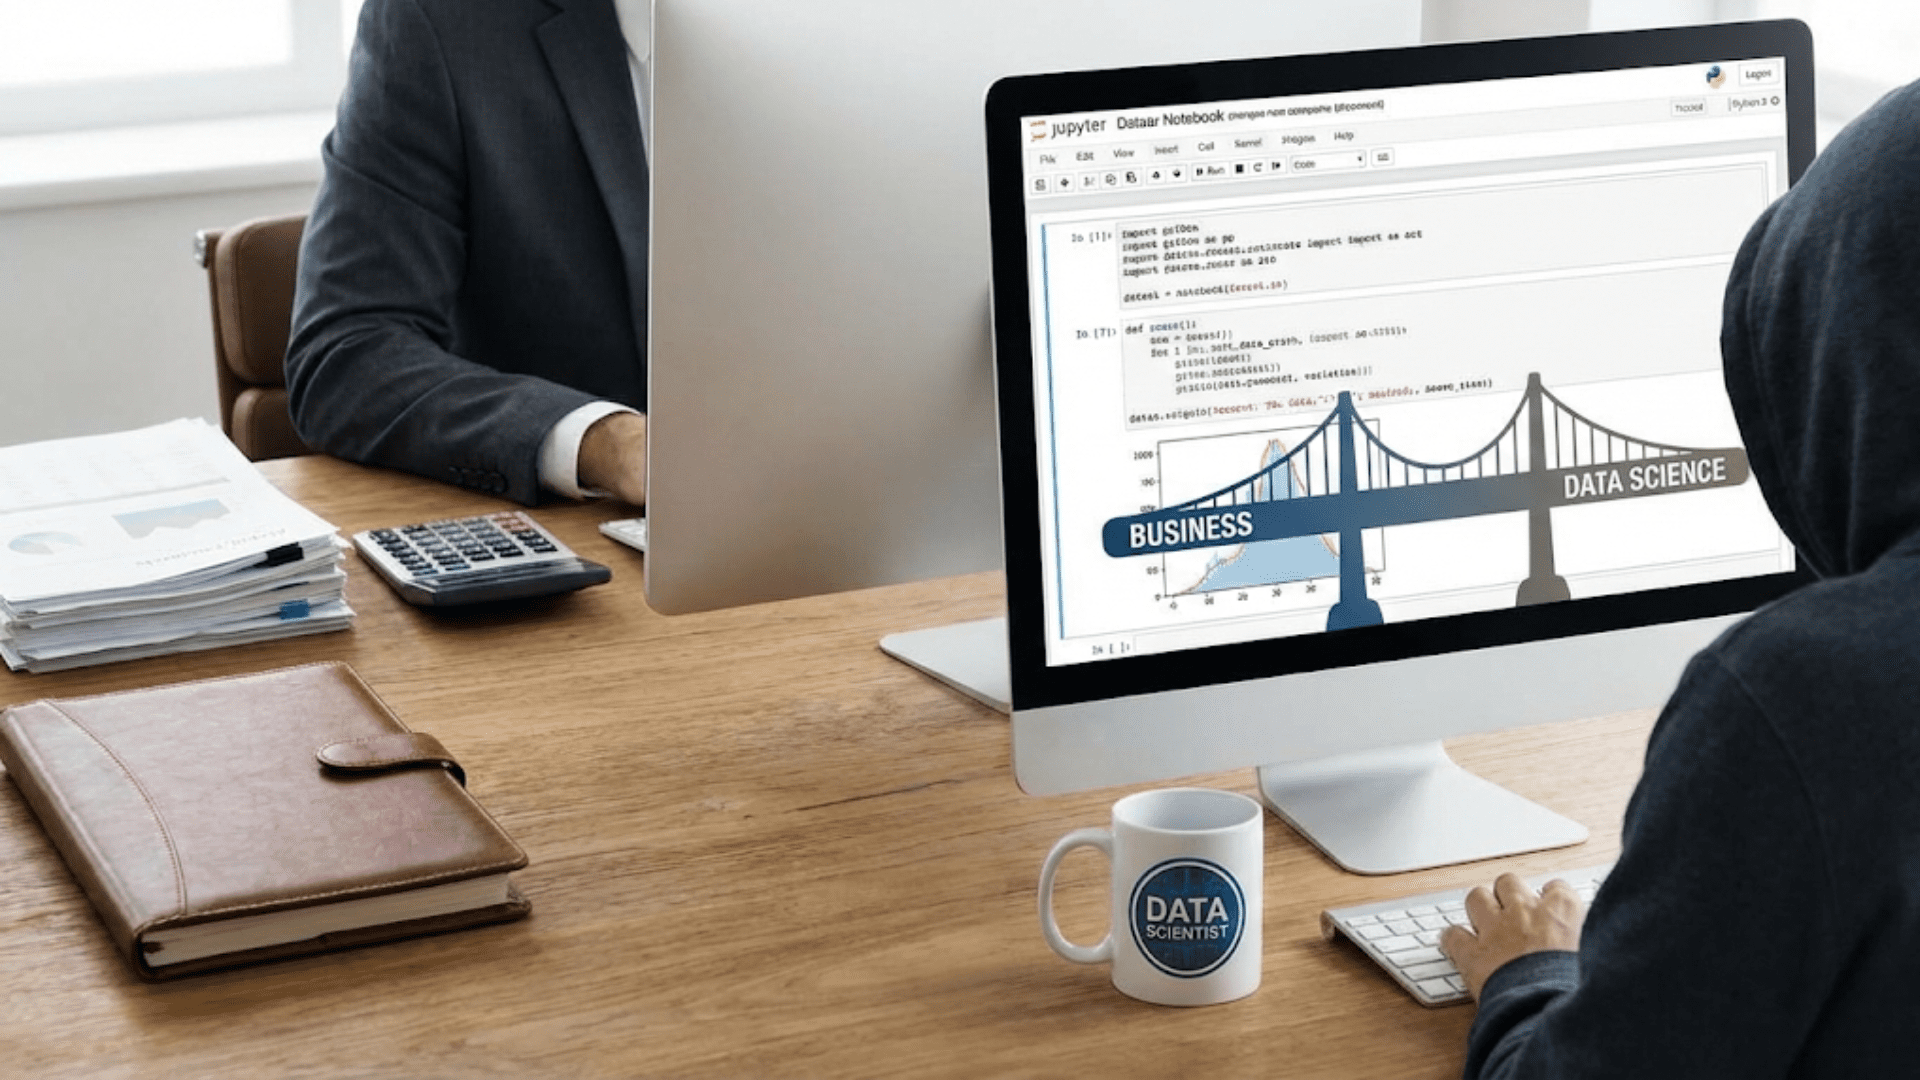
Moving into Data Science from a Business Background
Learn how to transition from business roles to data science. Discover how your business acumen…
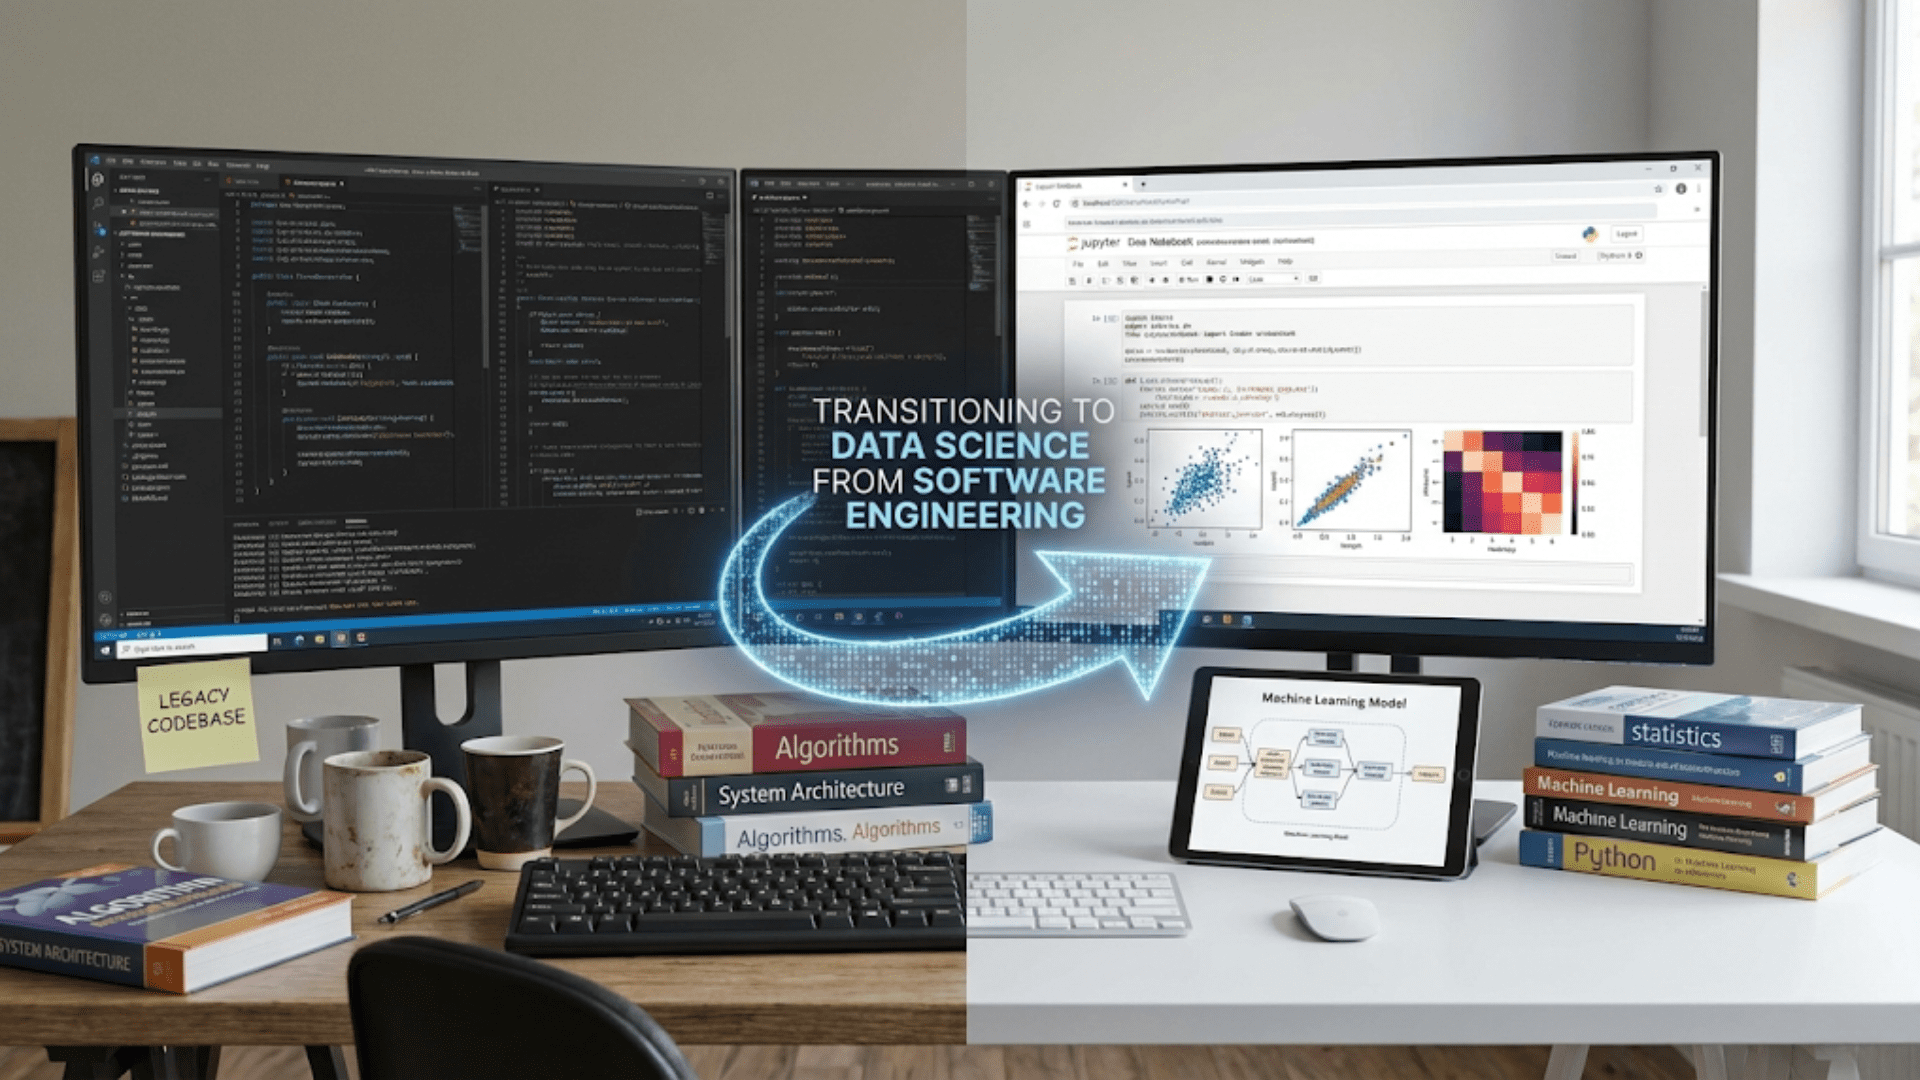
Transitioning to Data Science from Software Engineering
Learn how to successfully transition from software engineering to data science. Discover which skills transfer,…
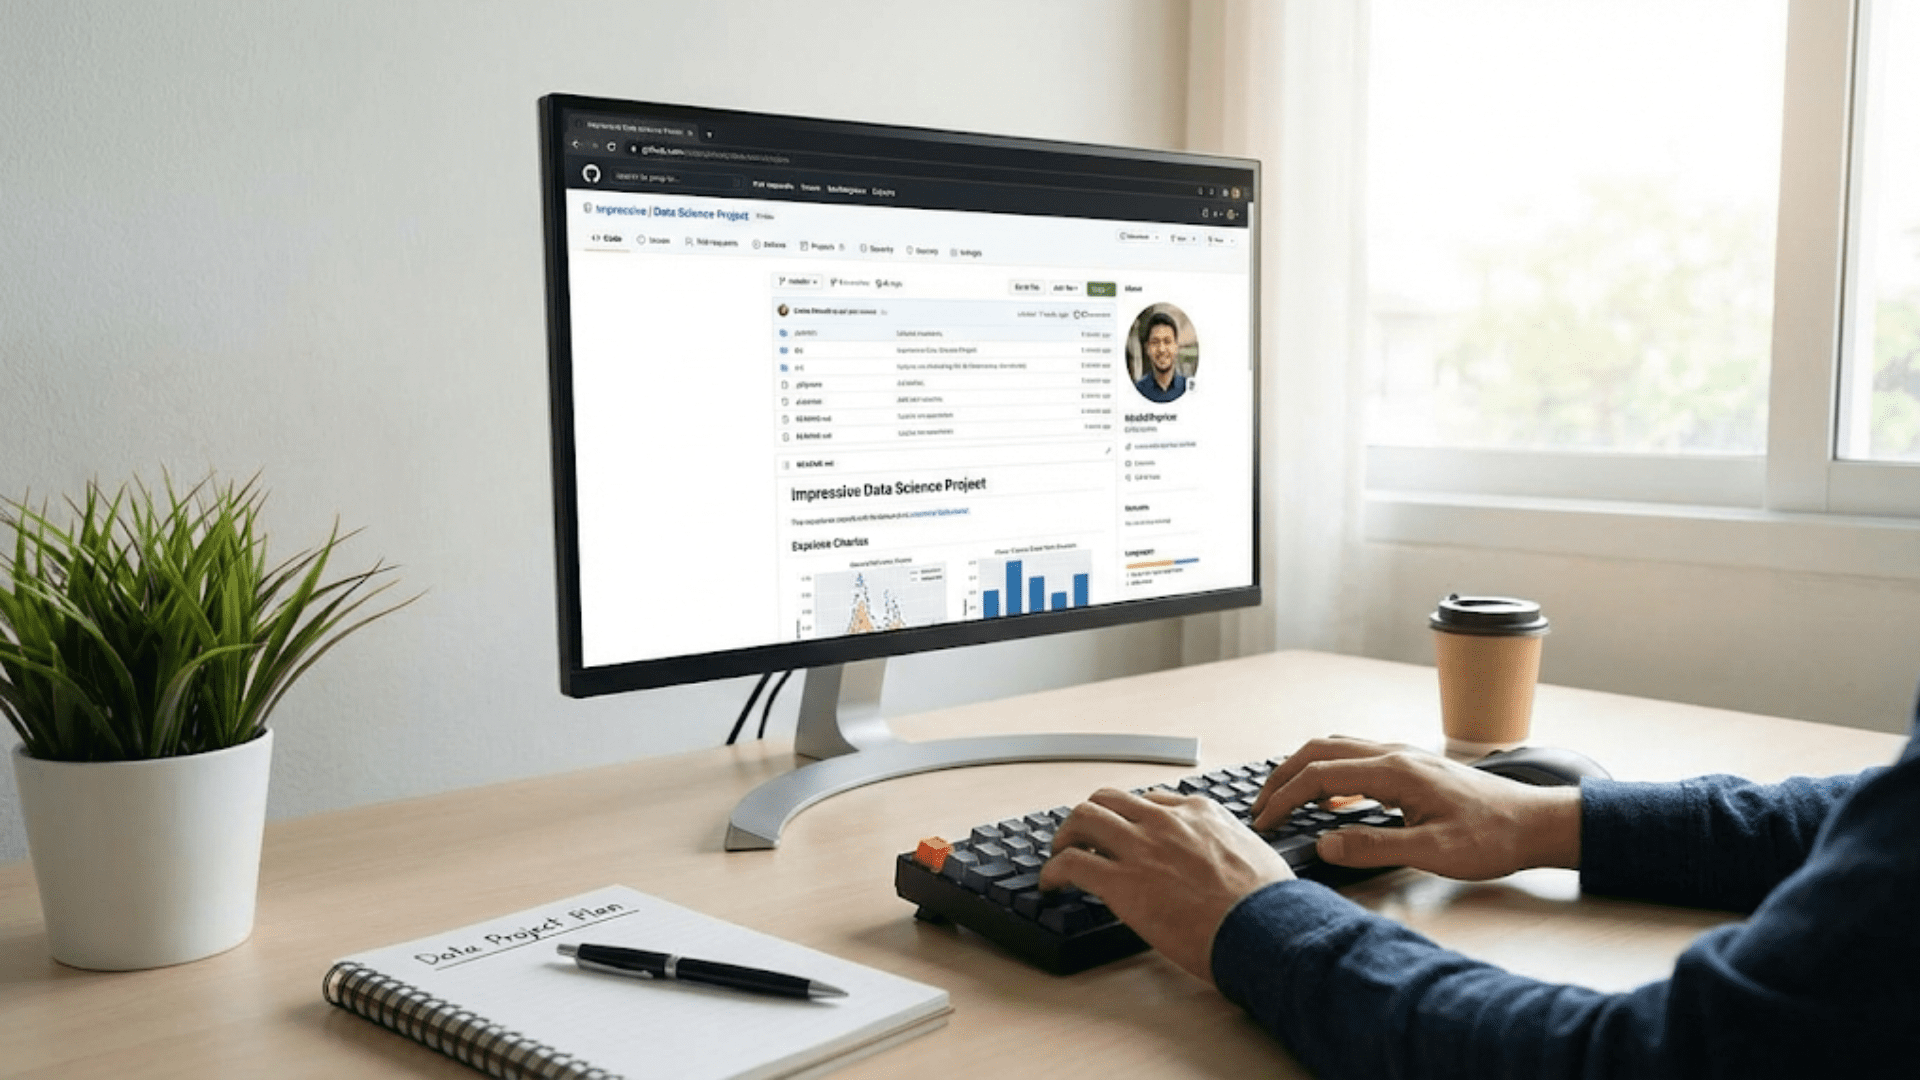
Creating an Impressive Data Science GitHub Repository
Learn how to build a standout GitHub repository for your data science portfolio. Discover best…

Writing About Your Data Science Projects: A Complete Guide
Learn how to write compelling documentation for your data science projects. Master README files, technical…

How to Choose a Data Science Portfolio Project That Gets You Hired
Learn how to select portfolio projects that impress employers and land data science jobs. Strategic…
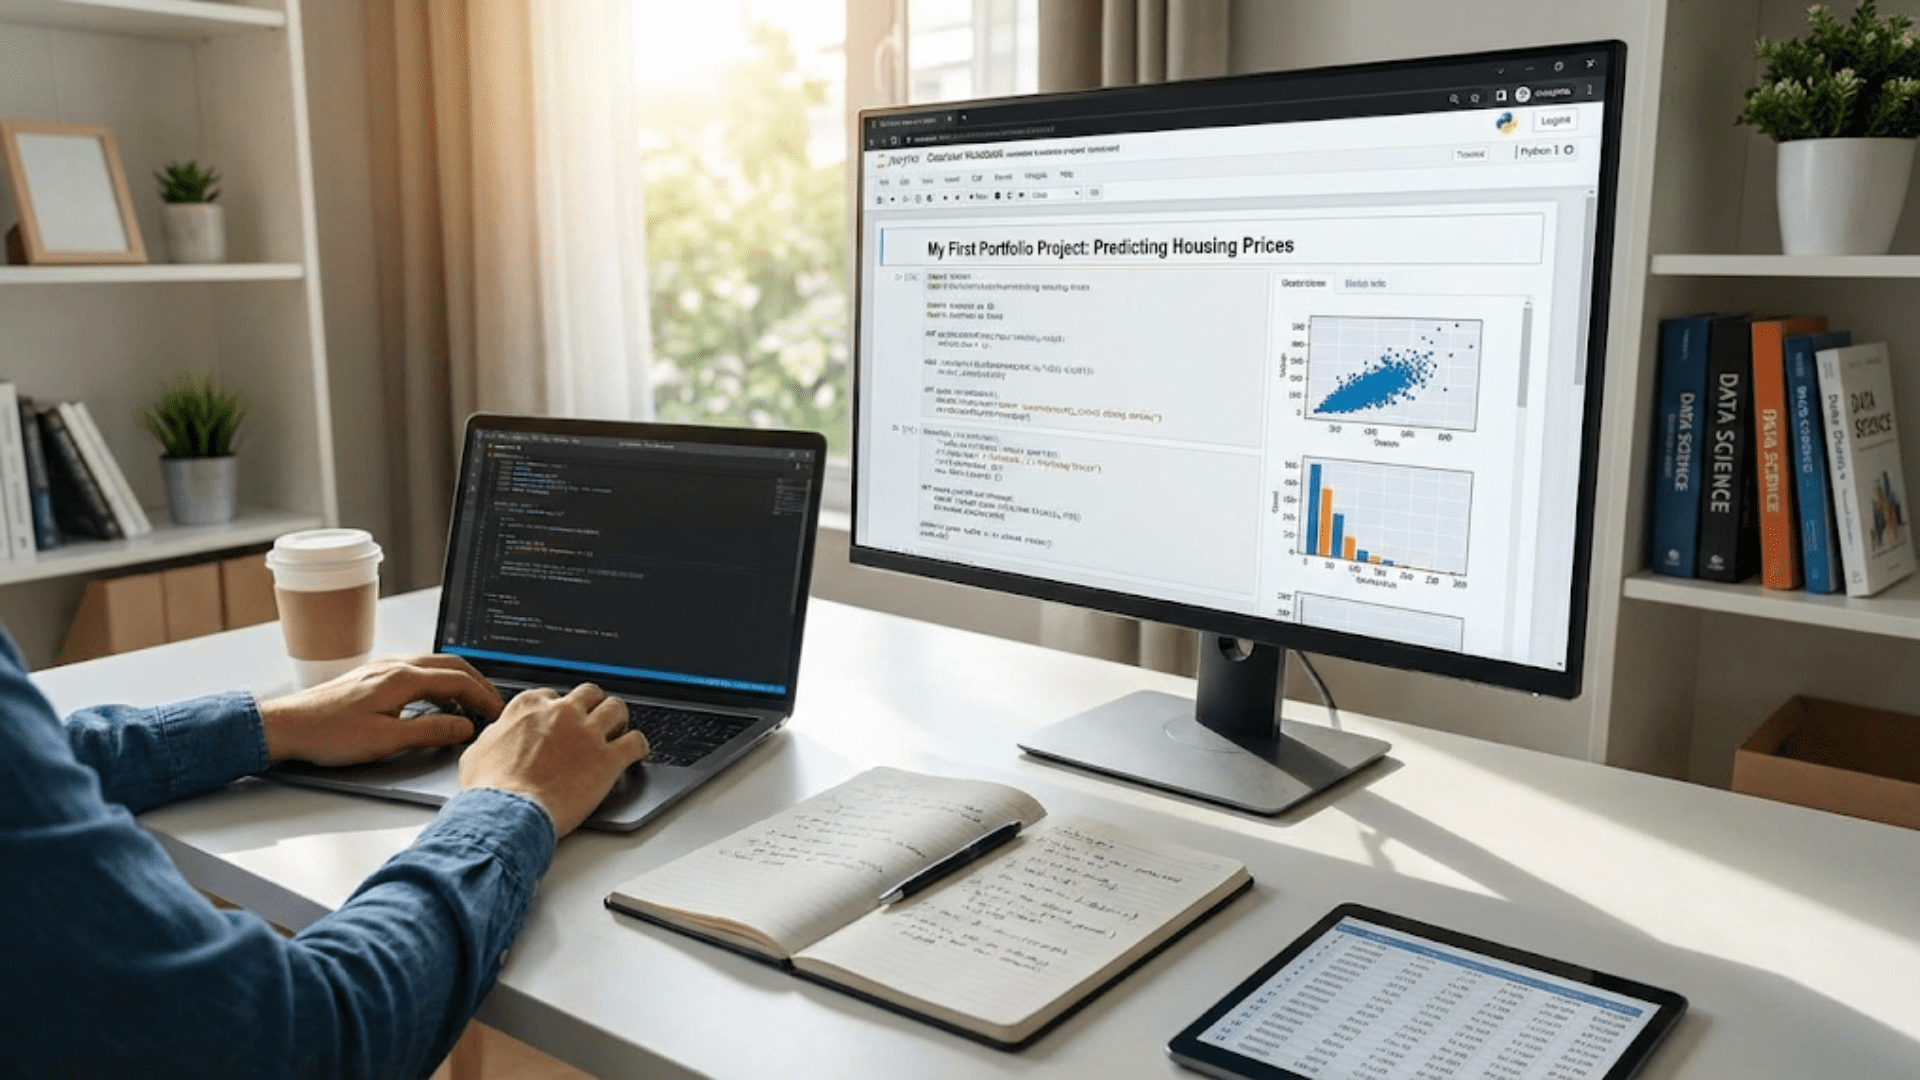
Building Your First Data Science Portfolio Project
Learn how to build your first data science portfolio project from scratch. Step-by-step guidance on…
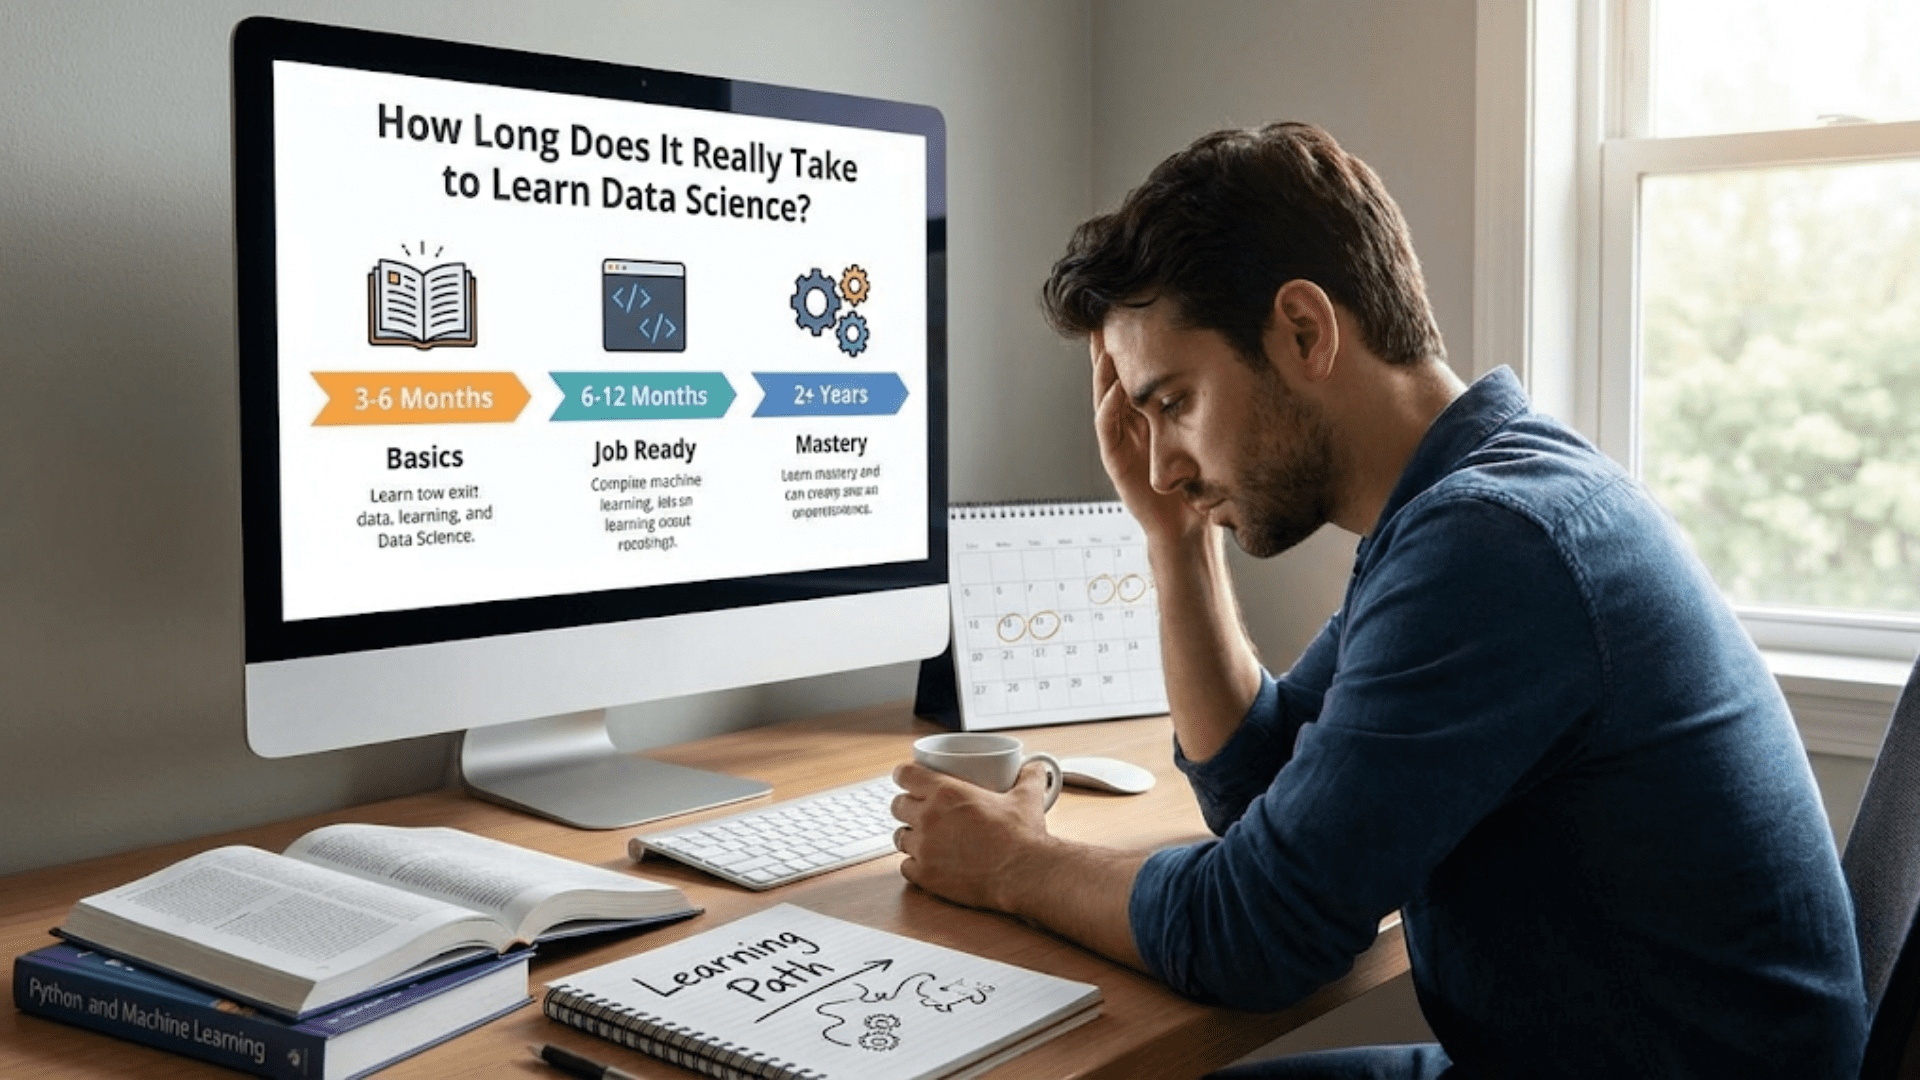
How Long Does It Really Take to Learn Data Science?
Wondering how long it takes to learn data science? Get realistic timelines for beginners, factors…
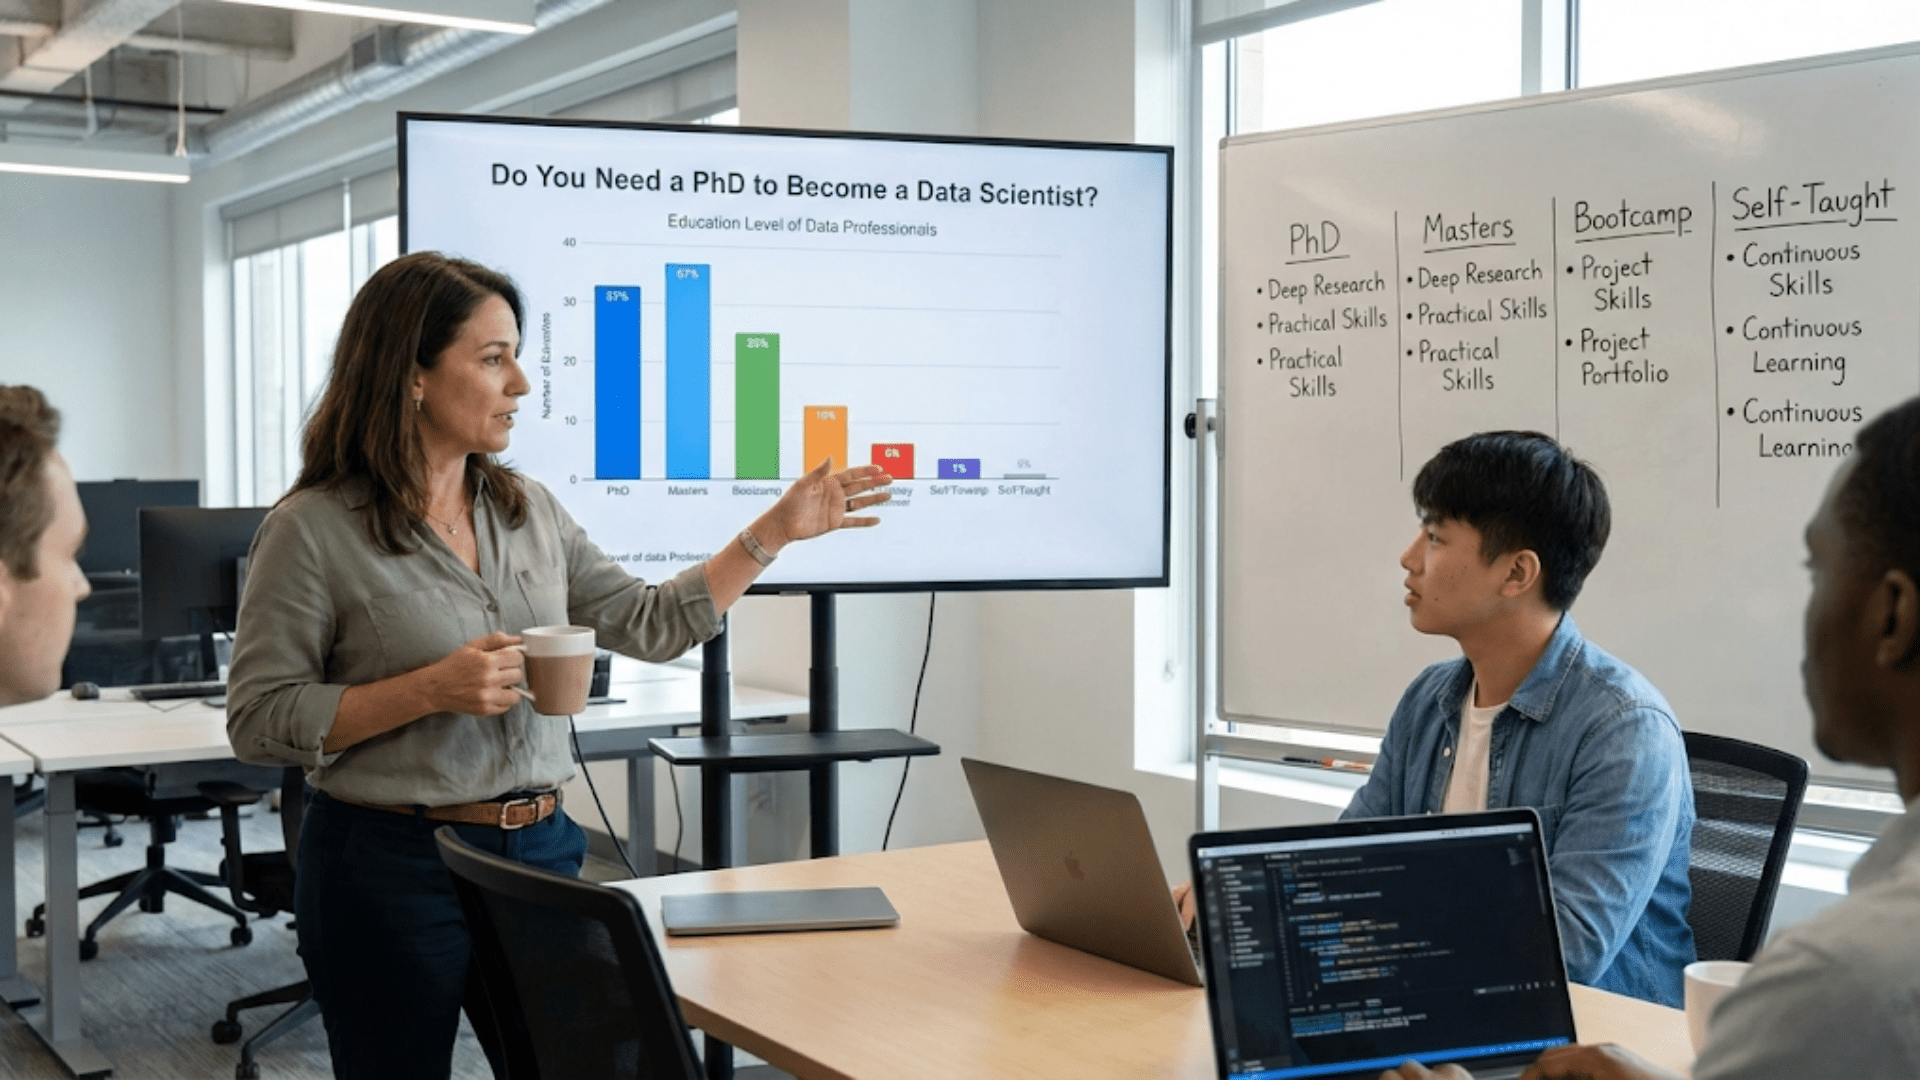
Do You Need a PhD to Become a Data Scientist?
Wondering if you need a PhD for data science? Learn the truth about educational requirements,…

10 Common Myths About Data Science Debunked
Discover the truth behind common data science myths. Learn what you really need to know…

Reading Your First CSV File with Python Pandas
Learn how to read CSV files in Python using pandas with this step-by-step guide. Includes…
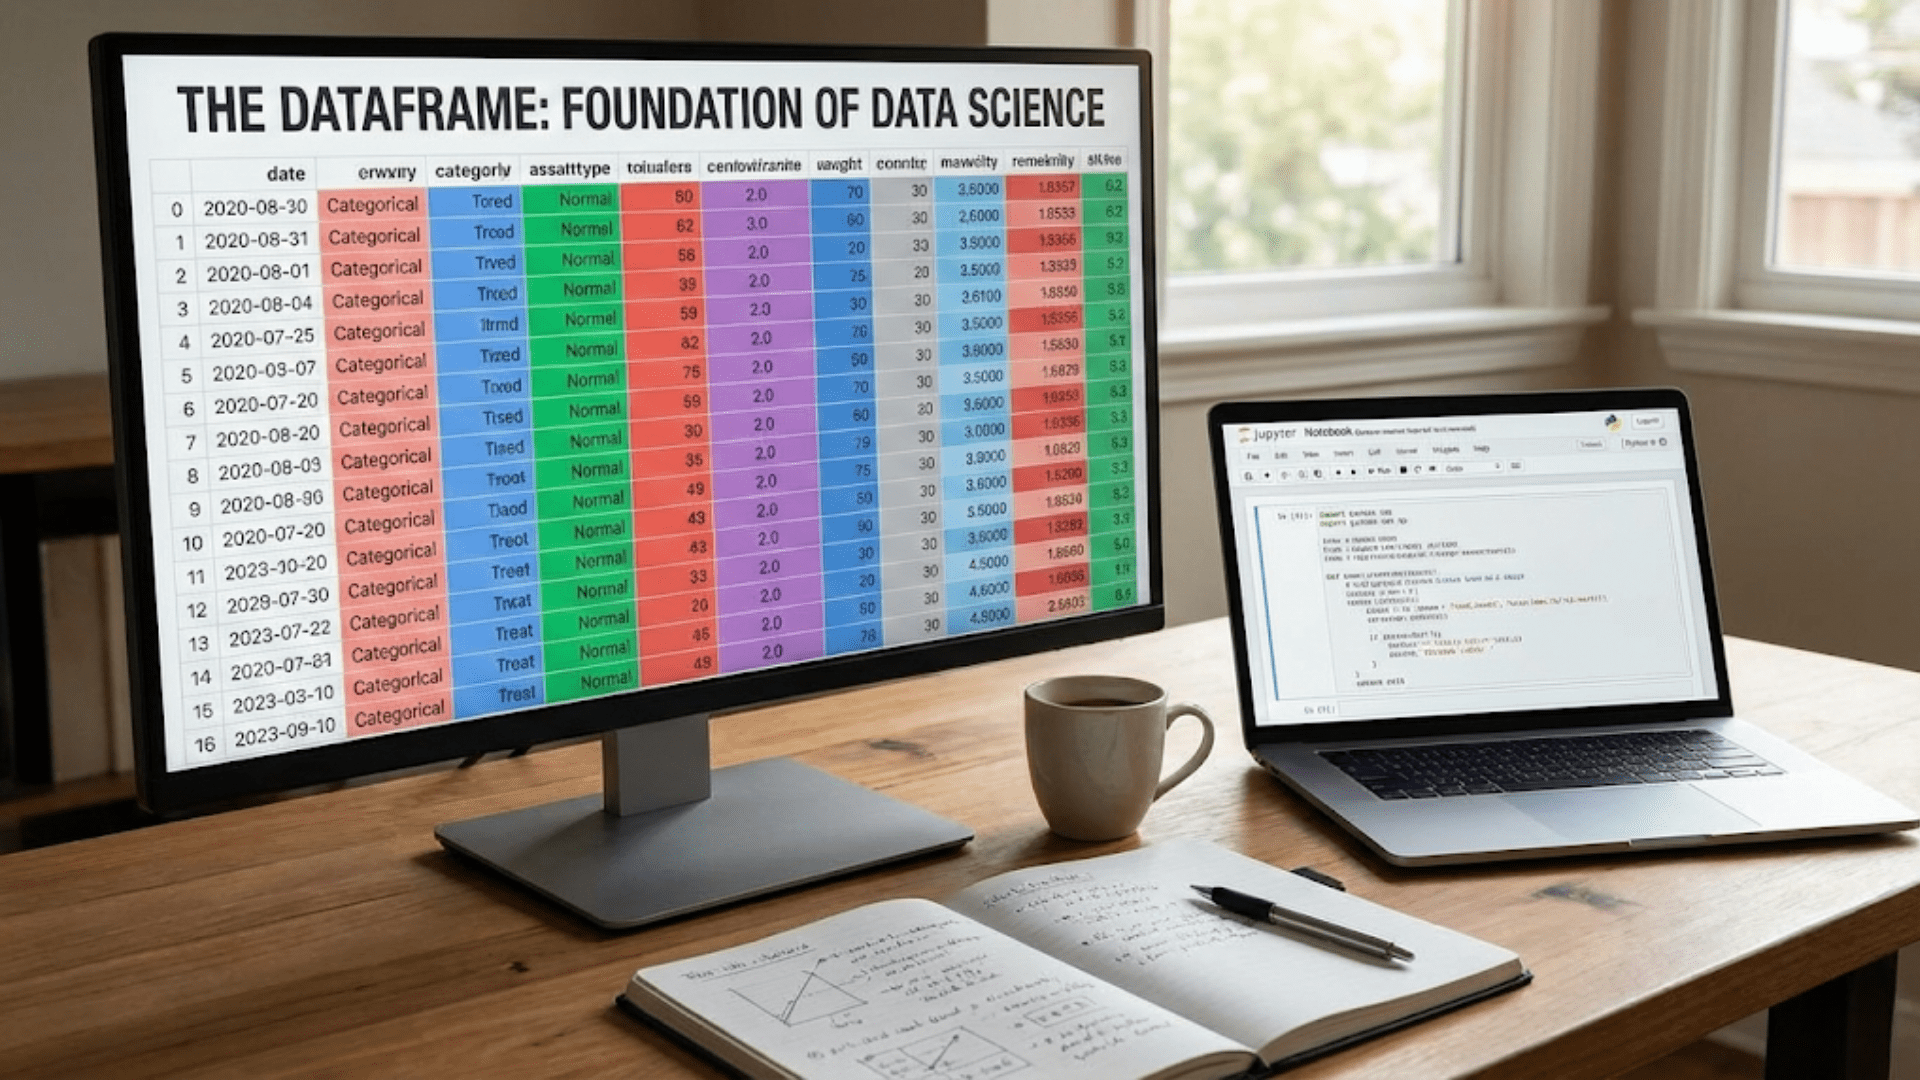
What is a DataFrame? The Foundation of Data Science
Learn what a DataFrame is and why it’s essential for data science. Complete guide covering…
More on Data Science
Conditional Statements in Python: Making Decisions with Data
Master Python conditional statements for data science. Learn if, elif, and else with practical examples…
Understanding Python Loops: For and While in Data Science Context
Master Python for and while loops for data science. Learn to iterate through data, process…
Writing Your First Python Function for Data Analysis
Learn to write Python functions for data analysis from scratch. Master function basics, parameters, return…
Python Lists, Tuples, and Dictionaries for Data Science
Master Python’s essential data structures: lists, tuples, and dictionaries. Learn when to use each structure…
Python Basics for Data Science: Variables and Data Types
Master Python fundamentals for data science. Learn variables and data types with practical examples. Perfect…
Networking for Data Scientists: Online and Offline Strategies
Master networking as a data scientist with proven strategies for building meaningful professional connections online…
Building a Personal Brand as a Data Scientist
Learn how to build a strong personal brand as a data scientist. Discover strategies for…
The Difference Between Junior, Mid-Level, and Senior Data Scientists
Understand the real differences between junior, mid-level, and senior data scientists. Learn what skills, responsibilities,…
Data Science Salaries by Experience Level and Location
Comprehensive analysis of data science salaries by experience level and location. Understand what data scientists…
Freelancing as a Data Scientist: Getting Started
Start your data science freelancing career with this complete guide. Learn how to find clients,…
Finding Your First Data Science Job: Strategies That Work
Land your first data science job with proven strategies that work. Learn how to position…
Self-Teaching Data Science: A 6-Month Study Plan
Master data science on your own with this detailed 6-month study plan. Week-by-week guidance covering…
Top Data Science Bootcamps Compared: Which is Right for You?
Compare top data science bootcamps including curriculum, cost, outcomes, and learning formats. Discover which bootcamp…
Should You Get a Data Science Certification? Pros and Cons
Discover whether data science certifications are worth your time and money. Learn about the pros…
How to Answer “Tell Me About a Data Science Project” in Interviews
Master the art of presenting your data science projects in interviews. Learn frameworks for storytelling,…
Creating a Data Science Resume That Stands Out
Learn how to create a standout data science resume that catches recruiters’ attention. Discover what…
Preparing for Technical Data Science Interviews
Master technical data science interviews with this comprehensive guide covering live coding sessions, algorithm implementations,…
Data Science Interview Questions: The Complete Guide for Beginners
Master data science interviews with this comprehensive guide covering common questions, technical concepts, coding challenges,…
How to Break Into Data Science with No Experience
Learn how to start a data science career from scratch with no prior experience. Discover…
Moving into Data Science from a Business Background
Learn how to transition from business roles to data science. Discover how your business acumen…
Transitioning to Data Science from Software Engineering
Learn how to successfully transition from software engineering to data science. Discover which skills transfer,…
Creating an Impressive Data Science GitHub Repository
Learn how to build a standout GitHub repository for your data science portfolio. Discover best…
Writing About Your Data Science Projects: A Complete Guide
Learn how to write compelling documentation for your data science projects. Master README files, technical…
How to Choose a Data Science Portfolio Project That Gets You Hired
Learn how to select portfolio projects that impress employers and land data science jobs. Strategic…
Building Your First Data Science Portfolio Project
Learn how to build your first data science portfolio project from scratch. Step-by-step guidance on…
How Long Does It Really Take to Learn Data Science?
Wondering how long it takes to learn data science? Get realistic timelines for beginners, factors…
Do You Need a PhD to Become a Data Scientist?
Wondering if you need a PhD for data science? Learn the truth about educational requirements,…
10 Common Myths About Data Science Debunked
Discover the truth behind common data science myths. Learn what you really need to know…
Reading Your First CSV File with Python Pandas
Learn how to read CSV files in Python using pandas with this step-by-step guide. Includes…
What is a DataFrame? The Foundation of Data Science
Learn what a DataFrame is and why it’s essential for data science. Complete guide covering…