Understanding the Journey from Question to Answer
Imagine being handed a massive jigsaw puzzle with thousands of pieces, but nobody has shown you the picture on the box. You do not know what the final image should look like, some pieces might be missing, others might not even belong to this puzzle, and you need to figure out not just how to assemble it but what story it tells. This scenario captures the essence of real data science work far more accurately than the polished tutorials and clean datasets you encounter in courses.
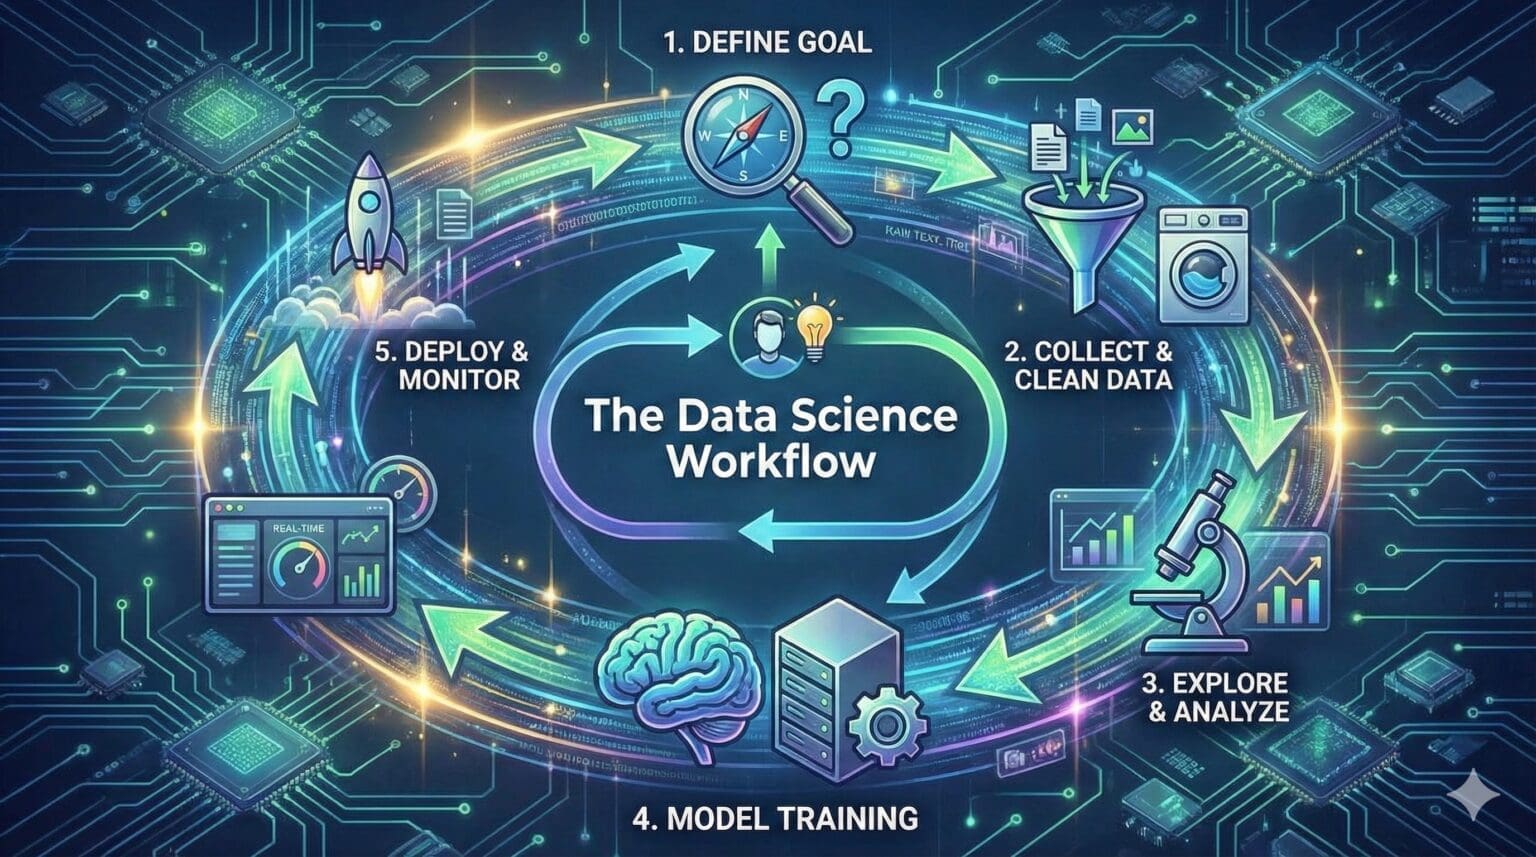
The data science workflow represents the systematic process that practitioners follow to transform business problems into actionable insights or automated systems. Unlike following a recipe where each step is prescribed and the outcome is predictable, data science requires iteration, creativity, and constant adjustment based on what you discover along the way. Understanding this workflow helps you navigate the messy reality of actual projects rather than just knowing isolated techniques.
Each data science project unfolds as a journey with distinct phases, though the boundaries between them blur and you frequently loop back to earlier stages as new information emerges. Experienced data scientists do not march linearly through these steps but rather spiral through them, refining their understanding and approach as they learn more about the data and problem. Let me walk you through this journey so you understand not just the what but the why and how of each phase.
Phase One: Problem Definition and Scoping
Every worthwhile data science project begins with a problem that needs solving or a question that needs answering. However, the initial problem statement rarely comes in a form that data can directly address. The first critical task involves translating vague business concerns into concrete, answerable questions that data science techniques can tackle.
A stakeholder might approach you saying something like “Our customers are unhappy and we are losing them.” This statement identifies a concern but does not yet define an actionable problem. Through careful questioning and discussion, you need to sharpen this into something specific. Are we losing more customers than usual? Which customer segments show the highest churn rates? Can we predict which customers will likely leave in the next three months? What factors most strongly correlate with customer departures? Each of these questions suggests different analytical approaches and requires different data.
The scoping phase requires you to understand the business context deeply. Why does this problem matter now? What decisions will be made based on your findings? Who are the stakeholders and what are their expectations? What constraints exist in terms of time, resources, and data availability? If you build a predictive model, how will it actually be used and by whom? These questions shape your entire approach and help you avoid wasting time on technically impressive work that nobody can use.
You must also establish success criteria during this phase. How will you and your stakeholders know if the project succeeded? For a predictive model, what level of accuracy is needed to be useful? For an exploratory analysis, what kinds of insights would be valuable? Setting these expectations upfront prevents misunderstandings later when you deliver results. Sometimes you discover during scoping that the proposed project is not feasible with available data or resources, and having this conversation early saves everyone time and frustration.
A crucial but often overlooked aspect of problem definition involves identifying what you will not do. Data science projects can easily expand in scope as new questions arise during analysis. Explicitly defining boundaries helps you stay focused and deliver results in reasonable timeframes. You might decide to focus on one customer segment first, use a subset of available data, or tackle prediction without trying to explain causation. These constraints are not limitations but rather strategic choices that make projects manageable.
Phase Two: Data Collection and Acquisition
Once you understand what problem you are solving, you need to identify and gather the data that might help you solve it. This phase often reveals the gap between ideal data and available data, requiring creative thinking about how to work with what exists rather than what you wish existed.
Data might live in multiple places across an organization. Customer information sits in a CRM system, transaction records reside in a financial database, website interactions get logged by analytics tools, customer support tickets exist in a help desk system, and product usage data flows from application logs. Your first task involves identifying all potentially relevant data sources and understanding what information each contains.
Accessing this data often proves more challenging than you might expect. Different systems may have different owners who need to approve data access. Data might be stored in formats that require special tools to read. Security and privacy restrictions might limit what data you can use and how you can use it. Some data might be archived and difficult to retrieve. Building relationships with data owners and understanding the technical landscape becomes essential.
As you examine available data, you frequently discover that it does not perfectly match your needs. The ideal would be detailed records of every customer interaction, perfectly categorized and labeled. Reality might give you incomplete records, inconsistent labeling, missing time periods, or data aggregated at the wrong level of granularity. You must assess whether available data can still address your question, perhaps with limitations, or whether you need to revise your approach.
Sometimes you can augment internal data with external sources. Public datasets, commercial data providers, or web scraping might provide additional context or features. However, each external data source introduces new challenges around quality, licensing, and integration. You need to evaluate whether the additional complexity and cost of incorporating external data justifies the potential value it adds.
Documentation becomes critical during data collection. You should record where each dataset comes from, when it was extracted, what filters or transformations were applied, and who owns the source system. This documentation might seem tedious when you are eager to start analyzing, but it becomes invaluable later when questions arise about data quality or when you need to refresh your analysis with updated data. Creating a data dictionary that explains what each field means and how it gets populated saves countless hours of confusion.
Phase Three: Data Cleaning and Preparation
If data collection often takes longer than expected, data cleaning typically consumes even more time, sometimes accounting for sixty to eighty percent of the total project effort. Raw data is messy in numerous ways, and preparing it for analysis requires patience, attention to detail, and systematic thinking.
Missing values represent one of the most common challenges. A survey question that some customers skipped leaves gaps in your data. A sensor that malfunctioned produces null readings. A database migration that happened years ago failed to transfer certain fields. You must decide how to handle these gaps. Sometimes you can delete records with missing values if you have plenty of data and the missing values appear random. Other times you might impute missing values by filling them with averages, values from similar records, or predictions from separate models. Each approach has implications for your analysis that you need to understand.
Outliers and errors require similar judgment calls. Is that customer who supposedly made one thousand purchases in a single day a data entry error, a test account that should be removed, or a real bulk purchaser that represents important behavior you should understand? Does that negative age value indicate corrupted data or a coding scheme you need to learn about? Investigating unusual values often reveals data quality issues or business logic you were not aware of. Simply removing anything that looks odd can distort your analysis, but keeping obvious errors corrupts it.
Data formatting inconsistencies create tedious but necessary work. Dates might be stored as text strings in various formats that need standardization. Categorical variables might have slight spelling variations like “New York,” “NY,” and “new york” that should be merged. Numeric fields might contain currency symbols or commas that prevent them from being treated as numbers. Text fields might have leading or trailing spaces that interfere with matching. Each of these requires careful cleaning to ensure consistency.
Data types need verification and potentially conversion. A field that should contain numbers might be stored as text because someone once entered a note instead of a value. A categorical field might be stored as numbers that look like they should be used in calculations but actually represent codes. Ensuring each field has the appropriate data type prevents errors in subsequent analysis.
You often need to transform data into forms suitable for analysis. Dates might need to be converted into day of week or month to capture seasonality. Text fields might need to be parsed to extract relevant information. Continuous variables might need to be binned into categories. Multiple tables need to be joined together carefully, ensuring you understand the relationships and do not accidentally duplicate or lose records.
Throughout cleaning, you should validate your work by examining summary statistics, checking for unexpected patterns, and reviewing samples of the transformed data. It is remarkably easy to make mistakes during cleaning that corrupt your data in ways that are not immediately obvious. Taking time to verify each transformation prevents compounding errors that could invalidate all subsequent work.
Phase Four: Exploratory Data Analysis
With clean data in hand, you can finally begin exploring it to understand patterns, relationships, and potential issues. Exploratory data analysis serves multiple purposes: building your intuition about the data, identifying potential features for modeling, checking assumptions, and finding problems you missed during cleaning.
Start by examining individual variables to understand their distributions and characteristics. Calculate summary statistics like mean, median, standard deviation, and quartiles. Create histograms or density plots to see distribution shapes. Check for skewness that might need addressing. Identify variables with very little variation that probably will not be useful. Look for unexpected patterns or values that suggest data quality issues.
Exploring relationships between variables reveals the structure in your data. Create scatter plots to see how numeric variables relate to each other. Calculate correlation matrices to identify strongly related variables. Use box plots to compare distributions across categories. Cross-tabulate categorical variables to understand their relationships. These explorations help you understand what might predict what and identify multicollinearity issues that could affect modeling.
For the specific problem you are trying to solve, explore how potential predictor variables relate to the outcome you care about. If you are predicting customer churn, examine how churn rates differ across customer segments, usage levels, or time periods. If you are analyzing sales, look at how sales vary by product, region, or season. These targeted explorations often reveal insights that directly inform your modeling approach or even answer business questions without needing complex models.
Visualization becomes your primary tool during exploration. Creating many plots quickly, examining them for patterns, and discarding most of them is a normal part of this process. You are not yet creating polished visualizations for presentations but rather using charts as thinking tools. The goal is to see the data from many angles until patterns and relationships become clear.
Throughout exploration, keep notes about what you discover. Which variables seem most promising? What relationships surprised you? What additional data might be helpful? What transformations might improve variables? What hypotheses do you want to test? These notes guide your next steps and help you communicate your thought process later.
Exploration also reveals limitations in your data. You might discover you do not have enough examples of rare but important events. Key variables might have too many missing values to be useful. The time period covered might not include important events or seasons. Understanding these limitations early helps you set appropriate expectations and adjust your approach.
Phase Five: Feature Engineering and Selection
Feature engineering transforms raw data into representations that machine learning algorithms can effectively learn from. This creative process often makes the difference between mediocre and excellent model performance, as the features you provide to algorithms constrain what patterns they can discover.
Creating new features from existing variables can capture relationships that raw data misses. For time-based data, you might extract day of week, month, quarter, or year as separate features to capture temporal patterns. You could calculate time differences between events, like days since last purchase. Rolling averages over different time windows might smooth out noise and reveal trends.
Combining variables through mathematical operations creates interaction features that capture joint effects. Multiplying price by quantity gives total value. Dividing distance by time gives speed. Taking ratios of variables can normalize values or create meaningful metrics. These engineered features sometimes prove more predictive than the original variables.
Text data requires special feature engineering. Converting text into numbers that models can use might involve counting word frequencies, calculating text statistics like length or readability scores, or using more sophisticated approaches like TF-IDF or word embeddings. The right approach depends on your problem and the amount of text data available.
Categorical variables with many unique values present challenges for most algorithms. You might need to group rare categories into an “other” category, use target encoding to represent categories by their relationship to the outcome, or apply dimensionality reduction techniques. Each approach has tradeoffs between information retention and model complexity.
Domain knowledge proves invaluable during feature engineering. Understanding the business context helps you create features that capture important patterns. Someone familiar with retail might know that the week before Christmas shows different patterns than regular weeks and create features to capture this. A healthcare expert might know which patient characteristics typically interact and create relevant interaction features.
Feature selection follows engineering, identifying which variables to actually use in your models. Using too many features can lead to overfitting, where models learn noise in the training data rather than true patterns. Using too few features means missing important information. Balancing these concerns requires testing different feature sets and evaluating their impact on model performance.
Statistical methods can help identify promising features. Calculate correlations between features and the outcome, though remember correlation does not guarantee predictive power in complex models. Use statistical tests to identify features with significant relationships to the outcome. Apply dimensionality reduction techniques like principal component analysis to reduce feature count while retaining information.
Model-based feature selection leverages algorithms themselves to identify important features. Train simple models and examine feature importance scores. Use regularization techniques that automatically reduce the influence of irrelevant features. Apply recursive feature elimination that iteratively removes the least important features and evaluates performance.
Remember that the best feature set depends on your specific problem, data, and algorithm. Features that work well for one algorithm might not help another. The goal is creating representations that make it easy for algorithms to discover the patterns you care about.
Phase Six: Model Building and Training
Model building represents the phase most people associate with data science, though as you now understand, it comes only after substantial preparatory work. This phase involves selecting appropriate algorithms, training them on your data, and iteratively refining your approach to achieve good performance.
Algorithm selection depends on your problem type and constraints. For predicting continuous values like sales amounts or temperatures, you need regression algorithms. For categorizing items into discrete groups like determining if an email is spam or not, you use classification algorithms. For finding natural groupings in data without predefined categories, clustering algorithms apply. The specific algorithm within each category depends on factors like interpretability needs, dataset size, and acceptable training time.
Start with simple models as baselines before moving to complex ones. A simple linear regression or decision tree provides a benchmark for comparison and often reveals whether more sophisticated approaches are needed. If a simple model performs well enough for your use case, the additional complexity of advanced methods might not be justified. Complexity should be earned through demonstrated performance improvements, not assumed to be better.
Training involves feeding your algorithm examples from your data so it can learn patterns. Most supervised learning algorithms work by showing them input features along with the correct output and letting them adjust their internal parameters to minimize prediction errors. This requires splitting your data into training and testing sets, using the training data to fit the model while holding out testing data to evaluate how well the model generalizes to new examples.
During training, you monitor various metrics to understand model performance. For classification, accuracy tells you the overall percentage of correct predictions, but precision, recall, and F1-score provide more nuanced views, especially for imbalanced datasets where one class is much rarer than others. For regression, metrics like root mean squared error or mean absolute error quantify how far predictions deviate from actual values.
Overfitting represents a constant danger in model building. A model that has memorized the training data rather than learned generalizable patterns will perform excellently on training data but poorly on new data. Cross-validation helps detect this by repeatedly training on different subsets of data and evaluating on held-out portions. Consistent performance across folds suggests your model has learned real patterns.
Hyperparameter tuning adjusts the settings that control how algorithms learn. Different algorithms have different hyperparameters, like the depth of decision trees, the number of neighbors to consider in k-nearest neighbors, or the learning rate in neural networks. Finding good hyperparameter values requires systematic search, either testing predefined combinations through grid search or using more efficient approaches like random search or Bayesian optimization.
You often train multiple models using different algorithms or feature sets and compare their performance. Each algorithm has strengths and weaknesses, and the best choice is not obvious before testing. An ensemble approach that combines predictions from multiple models sometimes outperforms any single model, though this increases complexity.
Throughout model building, maintain rigorous evaluation practices. Never evaluate on the same data used for training. Hold out a final test set that you touch only once to get an unbiased estimate of real-world performance. Be skeptical of results that seem too good to be true, as they often indicate data leakage or other problems. Document your experiments so you can understand what you tried and why.
Phase Seven: Model Evaluation and Interpretation
Building a model that achieves high accuracy on test data is not the end goal but rather a milestone. You must evaluate whether the model truly solves your business problem, understand how it makes predictions, and identify potential issues before deployment.
Business-oriented evaluation goes beyond statistical metrics to assess practical value. Does the model’s accuracy meet the threshold needed for the intended use case? What are the costs of different types of errors, and does the model’s error profile align with business priorities? Can the model make predictions quickly enough for the application? How often will it need retraining as patterns change?
Model interpretability becomes critical for many applications. Stakeholders need to understand why the model makes certain predictions to trust and effectively use it. Regulations might require you to explain decisions, particularly in sensitive domains like lending or hiring. Even from a development perspective, understanding model behavior helps you improve it and diagnose problems.
Different algorithms offer different levels of natural interpretability. Linear models and decision trees are relatively easy to understand because you can directly see how features influence predictions. More complex models like random forests or neural networks act more as black boxes, making good predictions but without obvious explanations for why.
Various techniques help interpret complex models. Feature importance scores show which variables most influence predictions overall. Partial dependence plots reveal how changing one feature affects predictions while holding others constant. Individual prediction explanations using methods like LIME or SHAP show which features drove specific predictions. These tools help you understand and trust complex models.
Error analysis reveals where and why your model struggles. Examine the examples your model predicts incorrectly. Do they share common characteristics? Do errors concentrate in particular segments of your data? Understanding failure patterns helps you improve the model through better features, more training data for underrepresented cases, or different modeling approaches.
Bias and fairness evaluation has become increasingly important as models influence important decisions affecting people’s lives. Does your model perform equally well across different demographic groups? Could it perpetuate or amplify historical biases present in training data? What unintended consequences might arise from deploying this model? These questions require careful thought and analysis beyond pure predictive performance.
Sensitivity analysis examines how robust your model is to changes in input data. If feature values shift slightly, do predictions change dramatically or remain stable? How does model performance degrade if data quality decreases? Understanding these sensitivities helps you set appropriate monitoring and determine acceptable operating conditions.
Phase Eight: Communication and Reporting
The most brilliant analysis delivers no value if you cannot communicate it effectively to stakeholders who will use it to make decisions. This phase involves translating technical work into insights that non-technical audiences can understand and act upon.
Know your audience and tailor your communication accordingly. Executives might need a high-level summary focused on business impact and recommendations. Technical stakeholders might want details about methodology and validation. End users might need practical guidance on interpreting and using model outputs. The same project often requires multiple presentations targeting different audiences.
Structure your communication around the business problem rather than the technical approach. Start with the question you set out to answer and the key findings, then explain how you reached those conclusions. Most audiences care more about what you discovered and what they should do about it than the specific algorithms you used. Technical details can come later for those interested.
Visualizations carry more impact than tables of numbers for most audiences. Create clear charts that highlight key patterns or findings. Use color purposefully to draw attention to important elements. Remove unnecessary decorations that distract from the message. Ensure axis labels and legends are clear. Every visualization should tell a specific part of your story.
Quantify uncertainty appropriately. Models make predictions with varying degrees of confidence, and stakeholders need to understand this uncertainty to make good decisions. Confidence intervals, prediction ranges, or probability scores help communicate that predictions are not certainties. Being honest about limitations builds trust even if it makes your work seem less magical.
Provide actionable recommendations based on your findings. Analysis that describes what you found but leaves stakeholders wondering what to do about it feels incomplete. Based on your insights, what actions should be taken? What are the expected impacts of those actions? What risks or caveats should be considered? Connecting data to decisions makes your work valuable.
Documentation serves different purposes than presentations. Create technical documentation that explains your methodology in enough detail that another data scientist could reproduce your work or build upon it. Document data sources, preprocessing steps, feature engineering decisions, modeling choices, and evaluation results. This documentation becomes invaluable when you need to update the analysis or when someone else needs to understand what you did.
For deployed models, create user documentation that explains how to use the system, interpret outputs, and recognize when something might be wrong. Include examples of correct use and common pitfalls. Make it easy for users to get help when they encounter issues.
Phase Nine: Deployment and Monitoring
For many projects, particularly those involving predictive models, deployment transforms your work from an interesting analysis into a system that creates ongoing value. This phase involves integrating your model into production systems where it can make predictions on new data automatically.
Deployment requires collaboration with engineering teams to handle technical implementation. Your model needs to be packaged in a format that production systems can use. Data pipelines must be created to feed new data to the model in the right format. Systems need to be built to collect model predictions and route them to where they are used. All of this must happen reliably and efficiently at whatever scale the application requires.
Model serving strategies vary depending on requirements. Batch prediction processes incoming data in groups on a schedule, perhaps scoring all customers once per day to identify churn risk. Real-time prediction systems respond to individual requests immediately, like fraud detection that must evaluate transactions as they occur. The right approach depends on how predictions will be used and the computational resources available.
Monitoring deployed models is critical because model performance typically degrades over time. The patterns that existed in training data change as the world evolves. Data distributions shift as customer behavior or external conditions change. These changes can cause models to become less accurate or even fundamentally wrong.
Set up monitoring to track multiple aspects of deployed models. Monitor prediction accuracy if you have access to actual outcomes to compare against predictions. Track the distributions of input features to detect data drift that might indicate changing patterns. Measure prediction distributions to identify unusual model behavior. Monitor system performance metrics like latency and throughput to catch technical issues.
Establish processes for model retraining and updating. Periodically retrain models on fresh data to adapt to changing patterns. Develop criteria for when updates are needed based on performance degradation or data shifts. Create procedures for validating updated models before deploying them to production. Balance the need for current models against the risks of deploying updates.
Create feedback loops that improve models over time. Collect information about prediction outcomes to evaluate accuracy. Gather user feedback about model usefulness. Track how model predictions are actually used in decision-making. Use this information to refine features, adjust training data, or modify the model itself.
Plan for model failures and edge cases. What happens if the model produces obviously wrong predictions? How do you handle inputs that fall outside the range of training data? What backup systems exist if the model becomes unavailable? Robust deployment anticipates problems and includes safeguards.
The Iterative Nature of Real Projects
Throughout this description of the workflow, I have presented phases in sequence for clarity, but real projects rarely proceed linearly. Instead, you constantly cycle back to earlier phases as you learn new information.
During exploratory analysis, you might discover data quality issues that send you back to data cleaning. While building models, you might realize you need additional features and return to feature engineering. Model evaluation might reveal that you misunderstood the business problem, requiring you to revisit problem definition. This iteration is not failure but rather the natural process of refining your understanding and approach.
Experienced data scientists embrace this iteration rather than fighting it. They start with a rough version of the entire workflow quickly, then refine each phase based on what they learn. This agile approach delivers partial results faster and allows course correction before investing too much time in wrong directions.
Communication happens throughout the project, not just at the end. Regular check-ins with stakeholders ensure your work remains aligned with their needs. Early sharing of preliminary findings prevents wasting time on analyses that stakeholders find unhelpful. Ongoing communication builds trust and understanding that makes final deliverables more impactful.
Practical Tips for Navigating the Workflow
Based on this understanding of the workflow, several practical strategies help you execute projects more effectively. Start simple and add complexity only when needed. A simple analysis that answers the question is better than a complex one that is still in progress. You can always refine later if needed.
Document as you go rather than trying to recreate your thinking later. Keep notes about decisions you made and why. Comment your code to explain the reasoning behind choices. Maintain a project journal that tracks what you tried and what you learned. This documentation saves time and prevents forgetting important details.
Version control your code and track your experiments. Use tools like Git to maintain a history of your code changes. Record different modeling experiments with their results so you can compare approaches and understand what worked. This systematic tracking prevents confusion and allows you to backtrack if needed.
Validate assumptions and results continuously. Check your work at each step before moving forward. Question results that seem surprising or too good to be true. Maintain healthy skepticism about your own analysis to catch errors early. It is much easier to fix problems when you find them immediately than after building on top of flawed work.
Collaborate and seek feedback from others. Fresh perspectives often spot issues you missed or suggest approaches you had not considered. Explaining your work to others helps clarify your own thinking and identifies gaps in your reasoning. Data science benefits from diverse viewpoints and collective intelligence.
Conclusion
The data science workflow transforms ambiguous business problems into concrete insights and solutions through systematic application of data, statistical thinking, and computational tools. Understanding this workflow helps you navigate real projects where data is messy, problems are complex, and solutions emerge through iteration and refinement.
Each phase of the workflow serves important purposes and cannot be skipped without consequences. Problem definition ensures you solve the right question. Data collection and cleaning create reliable foundations for analysis. Exploration builds understanding that guides modeling. Feature engineering provides algorithms with effective representations. Model building and evaluation create and validate solutions. Communication ensures insights drive decisions. Deployment and monitoring create sustained value.
The workflow is not a rigid prescription but a framework that adapts to different problems and contexts. Some projects emphasize certain phases more than others. The order might shift based on what you discover. The key is understanding the purpose of each phase and recognizing when to iterate back to earlier stages as you learn.
Mastering this workflow requires practice across many projects. Each project teaches you something about managing the process, avoiding pitfalls, and delivering value. As you gain experience, you develop intuition about which approaches work for different types of problems and how to navigate efficiently from problem to solution.
In the next article, we will explore the different types of data scientists and what they actually do in their day-to-day work, helping you understand which role might best match your interests and how different specializations fit within the broader field. This will give you a clearer picture of the various career paths available and what skills each emphasizes.
Key Takeaways
The data science workflow consists of interconnected phases including problem definition, data collection, cleaning, exploratory analysis, feature engineering, modeling, evaluation, communication, and deployment. These phases are not strictly linear but involve constant iteration as you refine your understanding and approach based on discoveries along the way.
Problem definition and scoping are critical first steps that translate vague business concerns into concrete questions that data can address, establishing success criteria and constraints that guide the entire project. Data cleaning typically consumes the majority of project time, requiring careful handling of missing values, outliers, formatting inconsistencies, and data quality issues.
Feature engineering often makes the difference between mediocre and excellent model performance by transforming raw data into representations that algorithms can effectively learn from, requiring both technical skills and domain knowledge. Model building includes algorithm selection, training, hyperparameter tuning, and rigorous evaluation practices that prevent overfitting and ensure models generalize to new data.
Communication and deployment transform technical work into business value by presenting findings in ways non-technical stakeholders can understand and integrating models into production systems where they create ongoing value. Successful data science requires embracing iteration, documenting your work, validating assumptions continuously, and maintaining healthy skepticism about your own analysis.