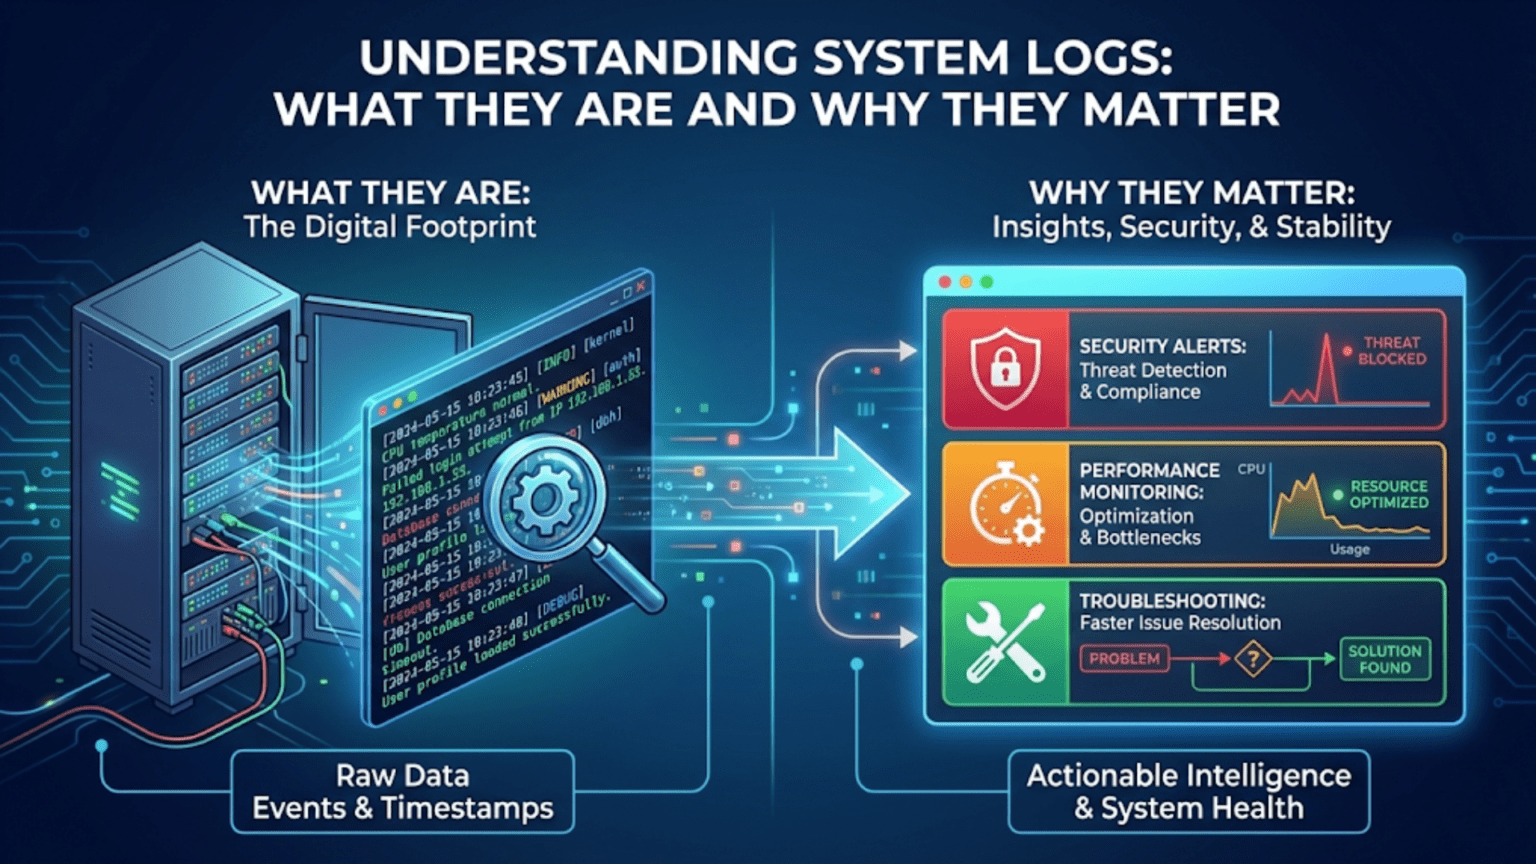
System logs are chronological records of events, activities, and messages generated by the operating system, applications, and hardware components. These logs capture information about system startup, errors, warnings, security events, application behavior, and user activities, providing a detailed history that administrators and users can analyze for troubleshooting problems, monitoring performance, detecting security incidents, and understanding system behavior over time.
Your computer is constantly recording its own story—documenting every application that starts, every error that occurs, every security decision made, and every system event that happens. These records are system logs, and they form an invaluable repository of information about what’s happening on your computer. When your system crashes, when applications misbehave, when security is compromised, or when you simply need to understand what your computer has been doing, system logs provide the answers. They serve as the black box recorder of your operating system, capturing details that would otherwise be invisible and ephemeral, preserving them for analysis when problems need solving or questions need answering. Understanding system logs transforms you from a passive computer user into someone who can diagnose problems, track system health, and gain deep insights into how your system operates.
System logs exist in every modern operating system, though the specific implementation, locations, tools, and conventions vary significantly between Windows, Linux, macOS, and other platforms. Despite these differences, the fundamental purpose remains constant: to provide a persistent, timestamped record of system activity that survives across reboots and can be examined when needed. Whether you’re a system administrator managing servers, a developer debugging applications, a security analyst investigating incidents, or a curious user wanting to understand what’s happening on your computer, system logs are an essential resource. This comprehensive guide explores what system logs are, what information they contain, where they’re stored, how different operating systems implement logging, how to read and interpret logs, the tools available for log analysis, and why logs matter for troubleshooting, security, compliance, and system understanding.
What System Logs Are and Their Purpose
System logs are text-based or structured records of discrete events that occur within a computer system. Each log entry, often called a log message or log record, typically contains a timestamp indicating when the event occurred, a severity level indicating how important or serious the event is, a source identifying which component generated the message, and descriptive text explaining what happened.
At their core, system logs serve as a communication mechanism from the system to humans. Operating systems and applications generate log messages to inform administrators, developers, or automated monitoring systems about their activities, status, problems, and decisions. Without logs, most system activity would be completely invisible—you would only know that something happened by observing its effects, with no way to understand the sequence of events that led to current state.
The fundamental purposes of system logs include troubleshooting and problem diagnosis. When something goes wrong—an application crashes, a service fails to start, hardware malfunctions, or system performance degrades—logs often contain clues about what happened and why. Error messages, stack traces, warning indicators, and the sequence of events leading to a failure all appear in logs, providing the information needed to identify and fix problems.
System monitoring and health tracking rely on logs. By examining logs regularly or using automated log analysis tools, you can detect problems before they become critical, identify trends indicating degrading performance or reliability, verify that systems are operating normally, and ensure services are available. Logs answer questions like “Is the backup running successfully every night?” or “Are we experiencing an unusual number of failed login attempts?”
Security incident detection and forensic analysis depend critically on logs. Security-related events—authentication attempts (successful and failed), privilege escalation, changes to security settings, suspicious network connections, malware detection—all generate log entries. When a security incident occurs, logs provide the evidence needed to understand what happened, how attackers gained access, what they did, and what data might be compromised. Many security compliance frameworks specifically require log collection and retention.
Performance analysis uses logs to understand system resource utilization, response times, throughput, and bottlenecks. Application logs might record request processing times, database query durations, or API call latencies, allowing identification of performance problems and tracking improvements after optimization.
Audit trails for compliance demonstrate that systems are operating according to policies and regulations. Many industries have compliance requirements mandating log collection—financial services (SOX), healthcare (HIPAA), payment processing (PCI DSS), and others require logs proving who accessed what data, what changes were made, and that security controls are functioning properly.
Application debugging benefits from logs where developers insert logging statements throughout code to track program execution, variable values, decision points, and error conditions. When bugs occur in production, logs provide visibility into what the code was doing when problems happened, often being the only window into production system behavior.
System logs differ from application-specific log files, though the distinction isn’t always clear. System logs typically refer to logs generated by the operating system itself—kernel messages, system service logs, authentication logs, system event logs. Application logs are generated by individual applications and might use the system logging facilities or write to their own files. In practice, modern logging systems often consolidate both into unified logging infrastructure.
Log Severity Levels and Message Classification
Log messages are classified by severity or priority level, allowing readers to quickly understand how serious or important a message is and enabling filtering to show only messages above certain importance thresholds.
The syslog protocol, originating in Unix systems but now a de facto standard, defines eight severity levels numbered 0-7, with 0 being most severe. Emergency (level 0) indicates system is unusable—the highest severity reserved for catastrophic failures requiring immediate attention. Alert (level 1) indicates action must be taken immediately, such as when a critical resource is depleted. Critical (level 2) indicates critical conditions like hard device errors. Error (level 3) indicates error conditions that should be addressed but aren’t immediately critical. Warning (level 4) indicates warning conditions—problems that might become errors if not addressed or unexpected situations that might indicate issues. Notice (level 5) indicates normal but significant conditions—important events during normal operation. Informational (level 6) provides informational messages tracking normal system operation. Debug (level 7) contains debug-level messages useful during development but typically too verbose for production.
Windows Event Log uses a different classification scheme. Error indicates a significant problem such as loss of functionality or data. Warning indicates a problem that isn’t immediately significant but might cause future problems. Information indicates successful operation of applications, drivers, or services. Success Audit (in Security log) indicates successful access control events like successful logins. Failure Audit indicates unsuccessful access control attempts like failed login attempts. These categories map roughly to syslog severity but aren’t identical.
Log levels serve multiple purposes. They allow filtering—you might normally view only warnings and errors but enable debug logging when troubleshooting specific issues. They indicate urgency—emergency and alert messages might trigger immediate notifications to administrators, while debug messages are only consulted when actively debugging. They control verbosity—production systems typically log at informational level, suppressing debug messages that would generate excessive volume, while development environments enable debug logging for detailed visibility.
Applications often make poor logging level choices. Common mistakes include logging normal operations as errors (generating noise that masks real problems), logging actual errors as informational messages (hiding problems), and using debug level for information that should always be logged. Well-designed logging uses severity levels appropriately—errors represent actual problems requiring attention, warnings indicate abnormal but handled situations, informational logs document normal important operations, and debug logs provide detailed tracing for development.
Context information in log messages increases their usefulness. Beyond just severity and message text, good log entries include timestamps with appropriate precision (often to millisecond or microsecond), process or thread identifiers (allowing correlation of related messages), user or session identifiers (tracking which user or session generated the message), source code location (file, function, line number in application logs), correlation IDs (allowing tracking of a request across multiple components), and structured data (key-value pairs or JSON objects rather than just free-form text).
Where Operating Systems Store Log Files
Different operating systems have different conventions for where log files are stored, what formats they use, and how they’re organized.
Linux and Unix-like systems traditionally store most system logs in the /var/log directory. This directory contains numerous log files and subdirectories, each serving different purposes. This directory contains numerous log files and subdirectories, each serving different purposes. The /var/log/sys.log file (on Debian/Ubuntu) or /var/log/mes.sages (on Red Hat/CentOS) contains general system messages from the kernel and system services, serving as the primary system log. The /var/log/au.th.log (Debian/Ubuntu) or /var/log/se.cure (Red Hat/CentOS) specifically logs authentication-related messages including login attempts, sudo usage, SSH access, and other security-relevant events. The /var/log/ke.rn.log contains kernel messages, /var/log/bo.ot.log contains messages from system startup, and /var/log/dm.esg contains kernel ring buffer messages particularly from hardware detection during boot.
ndividual services and applications often have subdirectories under /var/log. Apache web server logs to /var/log/ap.ache2/ or /var/log/ht.tpd/, MySQL to /var/log/my.sql/, and many other services follow similar patterns. Each application decides what to log to the system logger (which appears in syslog/messages) versus writing to its own files.
Modern Linux systems increasingly use systemd’s journal for logging, which stores logs in a binary format under /var/log/jo.urnal/ or /run/log/jo.urnal/. The journal stores structured log data with extensive metadata, queried using the journalctl command rather than reading text files directly. Many distributions now use journald as the primary logging mechanism while still forwarding to traditional text files for compatibility.
macOS stores system logs in several locations. Historical system logs resided in /var/log/ similar to other Unix systems, with system.log containing general system messages. However, modern macOS (10.12 Sierra and later) uses the unified logging system, storing logs in a binary format under /var/db/diag.nostics/ and /var/db/uuid.text/. These logs are viewed using the Console application or the log command-line tool rather than by reading text files. Application-specific logs often live in ~/Library/Logs/ (per-user) or /Library/Logs/ (system-wide), with each application creating its own subdirectory.
Windows stores event logs in a binary format in %SystemRoot%\System32\winevt\Logs\ (typically C:\Windows\System32\winevt\Logs). Rather than text files, Windows uses .evtx files that can only be read using Event Viewer or programmatic APIs. Windows maintains several primary logs: Application log contains events from applications and programs, System log contains events from Windows components and drivers, Security log contains audit events including login attempts and resource access, and Setup log contains events from Windows installation and updates. Additional logs exist for specific services like Windows PowerShell, Windows Defender, and various server roles. Applications can create their own event logs that appear alongside the system logs in Event Viewer.
FreeBSD and other BSD systems follow Unix conventions with logs in /var/log/, including /var/log/mes.sages for general system messages, /var/log/se.curity for security events, and /var/log/con.sole for console messages. The newsyslog utility handles log rotation on BSD systems.
Log rotation is essential because logs grow continuously and would eventually fill disk space. Log rotation systems like logrotate (Linux) or newsyslog (BSD) periodically rename current log files, compress old logs, and delete ancient logs according to configured retention policies. For example, /var/log/sys.log might be rotated daily, with the current day’s logs in syslog, yesterday’s in syslog.1, the day before’s compressed as syslog.2.gz, and logs older than a week deleted. This rotation keeps logs manageable while retaining sufficient history for analysis.
Reading and Interpreting Log Files
Understanding log file format and content allows extracting useful information from the stream of log messages.
Traditional syslog format follows a standard structure. A typical message looks like: “Jan 15 08:23:45 hostname processname[PID]: message text”. The timestamp comes first (often without year), followed by the hostname generating the message, the process name and optional process ID, and finally the actual message. Newer syslog implementations (rsyslog, syslog-ng) support more structured formats including RFC 5424 which adds severity, facility, and structured data.
Reading logs chronologically helps understand event sequences. If a service failed at 08:24, examining logs from a few minutes before (08:20-08:24) might reveal warnings or error messages leading to the failure. The temporal ordering of logs makes them particularly valuable for understanding causality—what happened and what preceded it.
Filtering and searching logs is essential given their volume. The grep command-line tool is fundamental for log analysis on Unix-like systems. “grep ERROR /var/log/sys.log” shows only lines containing “ERROR”, “grep -i fail /var/log/au.th.log” case-insensitively searches for failures, “grep ‘Jan 15 08:2’ /var/log/sys.log” shows logs from a specific timeframe. Multiple grep commands can be chained with pipes to narrow results progressively.
Pattern recognition in logs identifies recurring issues or trends. If you see “out of memory” messages appearing daily at 3 AM, this points to a specific process or job causing memory exhaustion. If failed login attempts all come from specific IP addresses, this indicates a targeted attack rather than random probing.
Correlation across multiple log files provides complete pictures of incidents. A web server error might correlate with database errors in the database log and firewall blocks in the firewall log—examining all three together reveals the full story. Timestamps allow matching events across logs even from different systems.
Error message interpretation requires understanding what components are reporting and what they mean. Kernel panic messages indicate critical kernel failures, while segmentation fault messages indicate application crashes from memory access violations. “Permission denied” messages point to file system permission problems, while “Connection refused” indicates network service issues. Learning to recognize common error patterns accelerates troubleshooting.
Structured logs using JSON or key-value pairs are increasingly common. Rather than free-form text, structured logs present data as: {“timestamp”: “2024-01-15T08:23:45Z”, “level”: “ERROR”, “service”: “web”, “message”: “Database connection failed”, “error_code”: 1045}. Structured logs are machine-parseable, allowing easier automated analysis, querying, and alerting.
Context around log messages matters. A single error message might be meaningless without understanding what the system was doing before and after. Reading 10-20 lines before and after an error often provides context—what was the system attempting when the error occurred, did it retry, how did it recover or fail.
Log Analysis Tools and Utilities
Numerous tools exist for viewing, analyzing, and extracting insights from log files, ranging from simple command-line utilities to sophisticated log management platforms.
Basic command-line tools form the foundation of log analysis. The tail command shows the end of files, with “tail -f /var/log/sys.log” following the file in real-time, displaying new lines as they’re appended—invaluable for monitoring live system activity. The head command shows the beginning of files. The cat command displays entire files (though this is impractical for large logs). The less or more commands allow paged viewing of files, letting you scroll through logs at your own pace.
The grep family of tools enables powerful text searching. Standard grep finds lines matching patterns, grep -v shows lines NOT matching patterns (useful for filtering out noise), egrep or grep -E uses extended regular expressions for complex patterns, and zgrep searches compressed log files without decompressing them first. Regular expressions allow sophisticated pattern matching—”grep ‘^Jan 15 08:2’ /var/log/sys.log” matches all messages from 08:20-08:29 on January 15.
The awk and sed text processing tools enable log transformation and extraction. Awk can extract specific columns from logs, calculate statistics, or reformat output. “awk ‘{print $5}’ /var/log/sys.log” prints the fifth column from each line. Sed performs text substitution and filtering—”sed -n ‘/ERROR/,/SUCCESS/p’ logfile” prints sections between ERROR and SUCCESS markers.
The journalctl command is the primary tool for querying systemd journal logs on modern Linux systems. “journalctl -xe” shows recent logs with explanatory text, “journalctl -u servicename” shows logs for a specific service, “journalctl –since ‘2024-01-15 08:00’ –until ‘2024-01-15 09:00′” shows logs from a time range, “journalctl -p err” shows only error-level messages, and “journalctl -f” follows logs in real-time similar to tail -f.
Windows Event Viewer provides graphical access to Windows event logs. You can filter by event level, time range, event ID, or source, create custom views combining multiple criteria, and export events to CSV or XML for further analysis. PowerShell’s Get-EventLog and Get-WinEvent cmdlets provide programmatic access: “Get-EventLog -LogName System -EntryType Error -Newest 50” retrieves the 50 most recent system errors.
The macOS Console application displays unified logging system logs, allowing filtering by process, subsystem, category, time range, and message content. The log command-line tool provides equivalent functionality: “log show –predicate ‘eventMessage contains “error”‘ –info” queries logs matching criteria.
Log aggregation and analysis platforms handle logs at scale. Splunk is a commercial platform that indexes logs from multiple sources, provides powerful search language, creates visualizations and dashboards, and generates alerts on patterns. The ELK stack (Elasticsearch, Logstash, Kibana) is an open-source alternative—Logstash collects and processes logs, Elasticsearch stores and indexes them, and Kibana provides visualization and search interfaces. Graylog is another open-source log management system offering centralized logging with search, analysis, and alerting.
Application-specific log viewers cater to particular log formats. Web server log analyzers like AWStats or GoAccess parse Apache/ng.inx logs and generate statistics about traffic, visitors, and errors. Database log analyzers understand database-specific log formats and can identify slow queries, deadlocks, or replication issues.
Real-time log monitoring tools provide live views of log activity. Multitail displays multiple log files simultaneously in a split-screen terminal view. Lnav (Log File Navigator) is a sophisticated terminal-based log viewer with syntax highlighting, automatic format detection, filtering, and query capabilities. GoAccess provides real-time web log analysis with ncurses-based output.
Log parsing libraries help developers build custom log analysis tools. Python’s logging module includes handlers for reading logs, Logstash’s grok patterns parse complex log formats, and regular expression libraries in all languages enable custom parsing logic.
Common Log Analysis Scenarios
Different situations require different approaches to log analysis, with common patterns and techniques applicable across many scenarios.
Troubleshooting application failures typically starts by identifying when the failure occurred, then examining logs around that timeframe. If an application crashed at 14:32, look at logs from 14:25-14:35. Search for error messages, stack traces, or exceptions. Trace backwards from the failure point—what was the application doing before it crashed? Often you’ll find warning messages minutes before the actual crash, indicating the root cause. Look for patterns like “out of memory” (resource exhaustion), “connection refused” (dependency failures), or “null pointer exception” (code bugs).
Investigating security incidents requires examining authentication and authorization logs. For suspected unauthorized access, check authentication logs for unusual login patterns—logins at odd hours, from unexpected locations, multiple failed attempts followed by success, or privilege escalation events. Security logs might reveal what an attacker did after gaining access—which files they accessed, what commands they ran, whether they installed backdoors. Correlation with network logs can identify the attacker’s IP address and communication patterns.
Performance degradation analysis looks for resource saturation or bottleneck indicators in logs. Application logs might show increasing response times over time. Database logs could reveal increasingly slow queries or lock contention. System logs might indicate CPU throttling, memory pressure, or disk I/O bottlenecks. Look for patterns in timing—does performance degrade at the same time each day (perhaps when a backup runs)? Does it correlate with traffic spikes?
Service outage diagnosis examines logs to determine why a service became unavailable. When a web server stops responding, check its error logs for causes—out of file descriptors, memory exhaustion, upstream dependency failures. Check system logs for whether the service crashed, was killed by the kernel (OOM killer), or stopped intentionally. Check network logs for connectivity issues. The sequence of events in logs usually reveals the cause.
Compliance auditing uses logs to verify policy compliance and answer “who did what when” questions. Access logs prove who accessed sensitive data and when. Change logs show who modified configurations or deployed code. Authentication logs demonstrate that access controls are functioning. Compliance requirements often specify what must be logged and how long logs must be retained.
Capacity planning analyzes historical logs to predict future resource needs. By examining resource utilization logs over weeks or months, you can identify trends—is disk space consistently growing, is memory usage increasing, are we approaching CPU limits? This data drives decisions about when to expand capacity.
Root cause analysis for recurring issues examines logs across multiple occurrences of a problem. If an application fails every few days, comparing logs from each failure might reveal commonalities—perhaps it always fails after processing a certain type of request, or after memory exceeds a threshold, or when a particular dependency is unavailable. Pattern recognition across incidents points to root causes.
User activity tracking examines logs to understand what users are doing. Application access logs show which features are used most, helping prioritize development. Authentication logs show when users log in and from where. Error logs filtered by user can identify users having problems, allowing proactive support.
Security and Privacy Considerations with Logs
While logs are invaluable for security and operations, they also present security and privacy concerns that must be managed appropriately.
Logs often contain sensitive information including usernames, IP addresses, URLs that might contain session tokens or API keys, personally identifiable information (PII) in error messages or request parameters, system architecture details useful to attackers, and authentication credentials if accidentally logged. This sensitive data must be protected from unauthorized access and, where appropriate, redacted or masked.
Log file permissions restrict who can read logs. On Unix-like systems, most logs in /var/log/ are readable only by root or specific system groups, preventing normal users from viewing potentially sensitive system information. Applications should create log files with appropriate permissions, ensuring sensitive logs aren’t world-readable. Windows event logs use ACLs to control access, with security logs typically restricted to administrators.
Centralized logging introduces security considerations. While sending logs to a central logging server improves management and analysis, it creates a single point of failure and an attractive target for attackers. Logs should be transmitted over encrypted channels (TLS/SSL) to prevent interception. The logging server itself must be hardened and monitored. Authentication should ensure only authorized systems can send logs and only authorized users can read them.
Log tampering prevention ensures logs remain trustworthy evidence. Attackers often try to delete or modify logs to hide their activities. Write-once log storage, cryptographic signing of log entries, and forwarding logs to append-only remote storage help prevent tampering. Some systems use write-only log files where even root can append but cannot modify or delete entries.
Privacy regulations like GDPR require careful handling of personal data in logs. Logs containing personal information may be subject to data protection requirements including the right to erasure (requiring the ability to remove specific individuals’ data from logs), access requests (requiring the ability to extract all logs containing someone’s data), and purpose limitation (logs should only be used for legitimate purposes, not indefinitely retained without justification).
Log retention policies balance the value of historical logs against storage costs, privacy concerns, and compliance requirements. Some regulations mandate minimum retention periods (you must keep logs for at least X days/months/years), while others mandate maximum retention (you must delete logs after X period unless specifically justified). Automated log rotation and deletion enforce retention policies consistently.
Redaction and masking remove or obscure sensitive data in logs. Credit card numbers might be logged with all but the last four digits masked (–-****-1234), passwords replaced with [REDACTED], and personal information anonymized or pseudonymized. This preserves log utility for troubleshooting while reducing privacy and security risks.
Audit logs of log access track who views or modifies logs, creating an accountability layer. If logs might be used as legal evidence, demonstrating the chain of custody and preventing tampering requires logging all log access and modifications.
Logging Best Practices for System Administrators
Effective log management requires following established best practices that maximize log utility while minimizing overhead and risk.
Configure appropriate verbosity levels balancing detail with volume. Production systems typically log at informational level, suppressing debug messages that would generate excessive volume and consume storage. However, the ability to temporarily increase verbosity when troubleshooting specific issues is valuable. Many systems support dynamic log level changes without requiring service restarts.
Implement comprehensive log rotation to prevent logs from consuming all disk space. Configure retention periods based on your needs—critical security logs might be retained for a year, debug logs only for a week. Compress rotated logs to save space. Monitor disk usage to ensure rotation is working correctly and storage isn’t depleting.
Centralize logs from multiple systems for easier analysis and correlation. When investigating issues spanning multiple servers, having all logs in one searchable repository is invaluable. Centralization also provides backup in case a system is compromised and local logs are destroyed. Tools like rsyslog, syslog-ng, Fluentd, or Logstash can forward logs to central collection points.
Synchronize time across all systems using NTP (Network Time Protocol). When correlating events across multiple logs or systems, accurate timestamps are essential. Time skew between systems makes correlation difficult or impossible. Ensure all systems use the same time zone (UTC is recommended) or clearly indicate timezone in timestamps.
Include context in log messages to make them useful without requiring cross-referencing multiple sources. Log entries should answer who (which user/process), what (what happened), when (timestamp), where (which system/component), and ideally why (what triggered this event). Poor: “Connection failed” Good: “Database connection failed to db.example.com:3306 for user app_user: timeout after 30s”
Use structured logging formats like JSON for logs intended for automated analysis. Structured logs are easier to parse, search, and aggregate than unstructured text. However, human-readable formats remain valuable for manual troubleshooting.
Monitor logs proactively rather than just examining them when problems occur. Automated monitoring can detect patterns indicating problems before they become critical—rising error rates, unusual authentication patterns, resource warnings. Tools like Nagios, Prometheus with Loki, or cloud-native monitoring services can alert on log patterns.
Document your logging configuration and log locations so team members know where to find information when troubleshooting. Create runbooks for common issues that reference specific log files and search patterns to use.
Test log collection and rotation regularly to ensure they’re working correctly. Verify logs are actually being generated, rotated on schedule, and purged when old. Test that centralized logging is receiving logs from all sources.
Secure logs appropriately given their sensitivity. Restrict access to those who need it, encrypt logs in transit and potentially at rest, and monitor access to logs themselves. Consider logs containing authentication data or personal information as sensitive data requiring protection.
Log Formats and Standards
While log content varies widely, several standard formats and protocols provide structure and interoperability.
The syslog protocol (RFC 5424) defines a standard format for log messages. A syslog message includes priority (combination of facility and severity), timestamp, hostname, application name, process ID, message ID, structured data (key-value pairs), and message text. This standardization allows different systems and applications to generate logs that can be processed by common tools.
Facility codes in syslog categorize the source of messages: kern (kernel messages), user (user-level messages), mail (mail system), daemon (system daemons), auth (authentication/authorization), syslog (syslog internal messages), lpr (print subsystem), and many others up to local0-local7 (reserved for local use). Combined with severity, facility allows detailed filtering and routing.
Common Event Format (CEF) is used particularly in security information and event management (SIEM) systems. CEF provides a standard format for security event logging, enabling different security products to generate logs that can be aggregated and analyzed together.
JSON (JavaScript Object Notation) has become a popular structured logging format. JSON logs are machine-readable, support nested structures, and are easy to parse in virtually any programming language. A JSON log entry might look like: {“timestamp”: “2024-01-15T08:23:45.123Z”, “level”: “ERROR”, “service”: “api”, “request_id”: “abc123”, “message”: “Request failed”, “duration_ms”: 1234, “status_code”: 500}
Windows Event Log format (EVTX) is a binary XML-based format that stores rich structured data. Each event has a schema defining its fields, allowing consistent parsing and analysis. Events include standard fields (timestamp, event ID, level, source) and event-specific data fields.
Apache Combined Log Format and Common Log Format are standard formats for web server access logs. Combined format includes: IP address, timestamp, request line (method, URL, protocol), status code, response size, referrer, and user agent. This standardization enables generic web log analyzers to work with logs from different web servers.
Grok patterns, developed for Logstash, provide named regular expressions for parsing common log formats. Patterns like %{COMMONAPACHELOG} or %{SYSLOGTIMESTAMP} match standard formats, making it easier to parse logs into structured fields for analysis.
Conclusion
System logs represent the comprehensive historical record of everything happening within your computer system—a detailed chronicle of operations, errors, security events, and system behavior that would otherwise be invisible and lost. From the humble beginnings of simple text files recording system messages to modern structured logging with rich metadata and sophisticated analysis platforms, logs have evolved to meet the growing complexity of computing systems while maintaining their fundamental purpose: providing visibility into system activity for troubleshooting, security, auditing, and understanding.
Understanding system logs—where they’re located, what information they contain, how to read and interpret them, and what tools can help analyze them—transforms your ability to work with computers effectively. Whether you’re tracking down the cause of a mysterious crash, investigating a security incident, demonstrating compliance with regulations, optimizing system performance, or simply satisfying curiosity about what your computer is doing, logs provide the answers. The difference between a computer user who understands logs and one who doesn’t is the difference between someone who calls support when problems occur and someone who can independently diagnose and often resolve issues by examining the evidence the system itself provides.
As systems grow more complex with distributed architectures, microservices, cloud computing, and containerization, logging becomes simultaneously more challenging and more critical. Modern systems might generate gigabytes of logs daily from hundreds of components across multiple servers, requiring sophisticated log aggregation, indexing, and analysis tools to extract meaningful insights from the data deluge. Yet despite this complexity, the fundamental principles remain: log important events with appropriate detail, preserve logs safely, make them searchable and analyzable, and use them proactively to understand and improve your systems. Whether you’re working with a single desktop computer or managing a global cloud infrastructure, mastery of system logs is an essential skill that pays dividends in reliability, security, and operational excellence.
Summary Table: System Log Locations and Tools Across Operating Systems
| Aspect | Linux | macOS | Windows |
|---|---|---|---|
| Primary Log Location | /var/log/ direc.tory | /var/log/ (legacy) /var/db/diag.nostics/ (unified logging) | %SystemRoot%\System32\winevt\Logs\ |
| Main System Log | /var/log/sys.log (Debian/Ubuntu) /var/log/mes.sages (RHEL/CentOS) | system.log (legacy) Unified logging database | System event log (System.evtx) |
| Authentication Log | /var/log/au.th.log (Debian/Ubuntu) /var/log/se.cure (RHEL/CentOS) | system.log or unified logging | Security event log (Security.evtx) |
| Application Log | /var/log/app.lication-specific directories | /Library/Logs/ ~/Library/Logs/ | Application event log (Application.evtx) |
| Kernel/Boot Log | /var/log/ke.rn.log /var/log/bo.ot.log dmesg | system.log or unified logging | System event log |
| Log Format | Plain text (traditional) Binary (systemd journal) | Plain text (legacy) Binary (unified logging) | Binary (EVTX format) |
| Primary Viewing Tool | tail, less, grep (text logs) journalctl (systemd) | Console.app log command-line tool | Event Viewer Get-EventLog (PowerShell) |
| Real-time Monitoring | tail -f /var/log/sys.log journalctl -f | log stream tail -f (for text logs) | Get-EventLog with -Newest Event Viewer (refresh) |
| Log Rotation | logrotate utility | newsyslog or log rotation in unified logging | Automatic rotation (size-based) |
| Default Retention | Varies by distribution (7-30 days typical) | Varies (often 30 days for unified logs) | By log size (typically 20MB default per log) |
| Remote Logging | rsyslog, syslog-ng | rsyslog or unified logging forwarding | Windows Event Forwarding (WEF) |
| Filtering/Search | grep, awk, sed | log show with predicates | Event Viewer filters Get-WinEvent with FilterHashtable |
| Structured Logging Support | Yes (systemd journal, rsyslog) | Yes (unified logging with subsystems) | Yes (XML-based event data) |
| Export Formats | Text, JSON (journal) | Text, JSON | CSV, XML, EVTX |
Common Log Severity Levels:
| Syslog Level | Number | Windows Equivalent | Meaning | Typical Use |
|---|---|---|---|---|
| Emergency | 0 | N/A | System unusable | Kernel panic, complete system failure |
| Alert | 1 | N/A | Action must be taken immediately | Critical resource exhaustion |
| Critical | 2 | Error | Critical conditions | Hard device errors, critical failures |
| Error | 3 | Error | Error conditions | Application errors, failed operations |
| Warning | 4 | Warning | Warning conditions | Potential problems, deprecation notices |
| Notice | 5 | Information | Normal but significant | Important state changes, configuration updates |
| Informational | 6 | Information | Informational messages | Normal operation tracking, routine events |
| Debug | 7 | Information (if logged) | Debug-level messages | Detailed debugging information |