

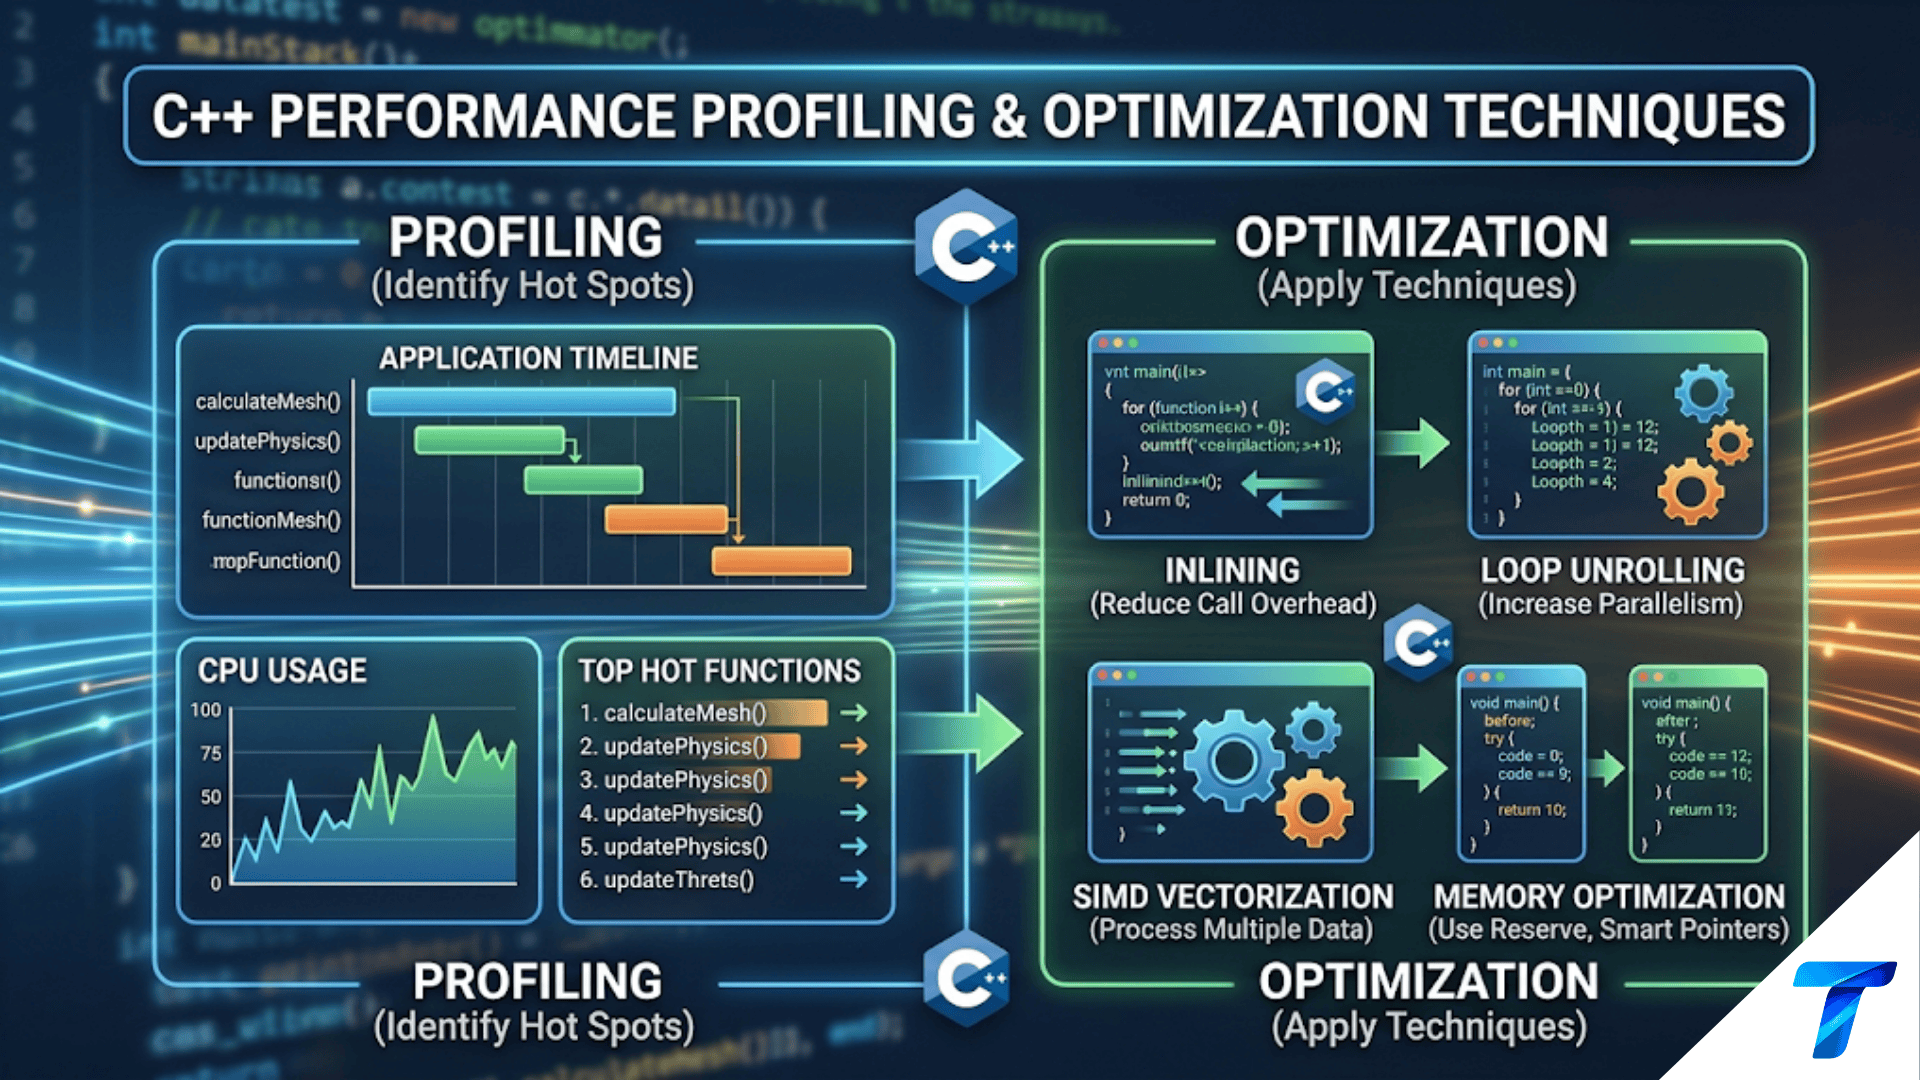

C++ performance optimization is an iterative process that must always begin with profiling to identify actual bottlenecks rather than guessing. The standard workflow is: Measure (using tools like perf, Callgrind, or Google Benchmark) -> Analyze (identifying CPU, memory, or I/O bound sections) -> Optimize (improving algorithms, data locality, minimizing allocations, or enabling compiler flags) -> Verify (re-measuring to ensure the optimization worked without altering program correctness). The golden rule of C++ optimization is: “Never guess about performance; always measure.”
Introduction
C++ is renowned as the language of choice for performance-critical applications—from high-frequency trading platforms and AAA game engines to embedded systems and real-time simulations. However, simply writing your code in C++ does not magically make it fast. Poorly written C++ can easily be outperformed by well-written Java, C#, or even Python.
Achieving true “bare-metal” performance requires a deep understanding of how your code interacts with the compiler and the underlying hardware. In this comprehensive guide, we will explore the essential tools and techniques for profiling C++ applications and the most effective optimization strategies to extract maximum speed.
Phase 1: The Golden Rule – Don’t Guess, Measure!
Donald Knuth famously wrote, “Premature optimization is the root of all evil.” Developers are notoriously bad at guessing where their programs spend the most time. Spending three days optimizing a complex mathematical function is useless if the program is actually spending 90% of its time waiting for a network response or allocating memory for strings.
Before changing a single line of code, you must Profile.
Macro-Profiling: Finding the Bottleneck
Macro-profiling involves running your entire application under a profiling tool to see the “big picture.”
- Linux
perf: The standard, low-level performance analyzing tool in Linux. It uses hardware performance counters to sample the CPU state with minimal overhead.# Record a profile of your application perf record -g ./my_application # View the interactive report perf reportperfwill show you exactly which functions are consuming the most CPU cycles. - Valgrind (Callgrind): While Valgrind is famous for finding memory leaks, its Callgrind tool is an instruction profiler. It simulates a CPU and counts the exact number of instructions executed, branch predictions, and cache misses. It is incredibly precise but runs your application significantly slower.
- Intel VTune Profiler / AMD μProf: These are heavy-duty, commercial-grade profilers provided by hardware vendors. They offer unparalleled insight into how your code utilizes specific CPU microarchitectures, memory bandwidth, and threading efficiency.
Micro-Benchmarking with Google Benchmark
Once you have identified a slow function, you need to isolate it and measure the impact of your optimizations. Google Benchmark is the industry standard for this in C++.
Here is how you set up a simple benchmark comparing passing a string by value vs. passing by reference:
#include <benchmark/benchmark.h>
#include <string>

// The slow way: Pass by value (forces a copy)
void ProcessStringValue(std::string s) {
    benchmark::DoNotOptimize(s.length()); // Prevent compiler from optimizing away the loop
}

// The fast way: Pass by const reference
void ProcessStringRef(const std::string& s) {
    benchmark::DoNotOptimize(s.length());
}

static void BM_PassByValue(benchmark::State& state) {
    std::string data(1000, 'x'); // A 1000-character string
    for (auto _ : state) {
        ProcessStringValue(data);
    }
}
BENCHMARK(BM_PassByValue);

static void BM_PassByRef(benchmark::State& state) {
    std::string data(1000, 'x');
    for (auto _ : state) {
        ProcessStringRef(data);
    }
}
BENCHMARK(BM_PassByRef);

BENCHMARK_MAIN();
When compiled and run, Google Benchmark will execute these loops thousands of times to give you statistically significant nanosecond-level timings, proving mathematically that the reference approach is faster.
Phase 2: The Memory Wall and Data Locality
In the 1990s, CPU speeds and RAM speeds were relatively close. Today, CPUs execute instructions hundreds of times faster than main memory can provide the data. This discrepancy is known as the “Memory Wall.”
Modern CPUs use layers of cache (L1, L2, L3) to bridge this gap. An L1 cache hit takes ~1-3 CPU cycles. A main memory fetch (a cache miss) can take ~100-300 cycles. Therefore, the most important optimization in modern C++ is Cache Locality.
Cache Lines and Traversal Order
Memory is not loaded into the CPU cache byte-by-byte; it is loaded in chunks called Cache Lines (typically 64 bytes). If you read an integer at memory address X, the CPU automatically loads the next 15 integers into the cache.
Consider traversing a 2D matrix. C++ uses row-major order (elements of the same row are contiguous in memory).
const int SIZE = 10000;
std::vector<std::vector<int>> matrix(SIZE, std::vector<int>(SIZE, 1));

// SLOW: Column-major traversal (Cache Thrashing)
void slow_traversal() {
    long long sum = 0;
    for (int col = 0; col < SIZE; ++col) {
        for (int row = 0; row < SIZE; ++row) {
            // Jumps wildly through memory. Almost every read is a cache miss!
            sum += matrix[row][col];
        }
    }
}

// FAST: Row-major traversal (Cache Friendly)
void fast_traversal() {
    long long sum = 0;
    for (int row = 0; row < SIZE; ++row) {
        for (int col = 0; col < SIZE; ++col) {
            // Reads contiguous memory. The CPU hardware prefetcher loves this!
            sum += matrix[row][col];
        }
    }
}
In benchmarks, fast_traversal can easily be 10x to 20x faster than slow_traversal purely because it plays nicely with the CPU cache.
Array of Structures (AoS) vs. Structure of Arrays (SoA)
Object-Oriented Programming teaches us to group related data into objects (AoS). However, for high-performance computing (like rendering or physics), this can ruin cache locality if you only need to process one field.
Array of Structures (AoS) – The OOP Way:
struct Particle {
    float x, y, z;
    float velocityX, velocityY, velocityZ;
    float mass;
    int color;
};
std::vector<Particle> particles; // 32 bytes per particle
If you write a loop to just update the x positions, you load the entire 32-byte Particle into the cache, update 4 bytes (x), and ignore the other 28 bytes. This wastes cache space and memory bandwidth.
Structure of Arrays (SoA) – The Data-Oriented Way:
struct ParticleSystem {
    std::vector<float> x, y, z;
    std::vector<float> velocityX, velocityY, velocityZ;
    std::vector<float> mass;
    std::vector<int> color;
};
ParticleSystem system;
Now, if you loop through system.x, the CPU loads exactly what it needs: tightly packed, contiguous floats. Cache utilization is 100%, and this structure is also easily vectorizable using SIMD instructions.
Phase 3: Minimizing Allocations and Copies
Dynamic memory allocation (using new, malloc, or adding to a container that forces a reallocation) involves asking the operating system for memory. This requires locking mechanisms in the OS kernel and is remarkably slow compared to stack allocations.
1. Pre-allocate with reserve()
If you know roughly how many items will go into a std::vector or std::string, use reserve().
std::vector<int> processData() {
    std::vector<int> results;
    // Without reserve, vector doubles its capacity repeatedly,
    // causing multiple allocations and data copies.

    results.reserve(1000000); // Only ONE allocation happens here.

    for (int i = 0; i < 1000000; ++i) {
        results.push_back(i);
    }
    return results;
}
2. Leverage Move Semantics (C++11)
Before C++11, returning large objects from functions resulted in expensive deep copies. Move semantics (std::move) allow resources to be “stolen” rather than copied.
While the compiler often performs Return Value Optimization (RVO) automatically, you should explicitly use move semantics when transferring ownership, passing large objects into constructors, or swapping data.
3. Embrace std::string_view (C++17)
Passing strings around often leads to unnecessary heap allocations. A std::string owns its memory. If you just need to read a string, passing it by const std::string& is okay, but creating substrings forces a new allocation.
std::string_view is essentially a non-owning pointer to a character array and a length. It is incredibly cheap to copy and pass around.
#include <string_view>

// Good, but taking a substring creates a brand new string allocation.
void parse_old(const std::string& data) {
    std::string token = data.substr(0, 5); // HEAP ALLOCATION!
    // ...
}

// Better! std::string_view is non-owning.
void parse_modern(std::string_view data) {
    std::string_view token = data.substr(0, 5); // NO ALLOCATION! Just adjusts a pointer and length.
    // ...
}
Phase 4: Algorithmic Complexity
No amount of cache optimization or move semantics will save an $O(N^2)$ algorithm dealing with millions of elements. Choosing the right container and algorithm is paramount.
- Use
std::vectorby default: Because of cache locality,std::vectoralmost always beatsstd::list(linked list), even for insertions in the middle of small collections. The overhead of following pointers in a linked list ruins cache performance. std::mapvsstd::unordered_map:std::mapis implemented as a Red-Black tree (pointer chasing, slow lookups: $O(\log N)$).std::unordered_mapis a hash table ($O(1)$ lookups). Unless you explicitly need the data to be sorted, always usestd::unordered_map.- Binary Search: If you have data that is written once and read many times, sort a
std::vectorand usestd::lower_boundinstead of using astd::set.
Phase 5: Compiler Optimizations
The C++ compiler is an incredibly advanced piece of software. Sometimes, the best optimization is simply getting out of its way and giving it the right flags.
- Optimization Levels: Always build release versions with
-O3(GCC/Clang) or/O2(MSVC). - Architecture Targeting: By default, compilers generate generic assembly that runs on 15-year-old CPUs. If you are compiling on the machine that will run the code, use
-march=native. This allows the compiler to use modern instruction sets (like AVX2 or AVX-512) specific to your CPU architecture. - Link-Time Optimization (LTO): Compilers usually optimize one
.cppfile at a time. Enabling LTO (-fltoin GCC/Clang) allows the compiler to see the whole program during the linking phase, enabling aggressive inlining across different translation units. - Branch Prediction (
[[likely]]/[[unlikely]]): CPUs guess which way anifstatement will go to keep the pipeline full. C++20 allows you to give the compiler hints:if (error_code != 0) [[unlikely]] { handle_error(); }This ensures the “happy path” is optimized to be as fast and contiguous in memory as possible.
Conclusion
Optimizing C++ is a science, not a guessing game. It requires a solid grasp of how algorithms scale, how the CPU cache dictates memory access patterns, and how to avoid the hidden costs of dynamic allocations.
Remember the golden cycle of optimization:
- Write clean, readable code first.
- Profile the application under realistic loads.
- Identify the hottest 5% of the code.
- Apply optimizations (Algorithms -> Cache Locality -> Micro-optimizations).
- Benchmark to verify the improvement.
By mastering tools like perf and Google Benchmark, and respecting modern paradigms like Data-Oriented Design and std::string_view, you can unlock the true, blistering performance that makes C++ the king of systems programming.

